Day Trading Indicators: Key Takeaways
- Three day trading indicators my students and I use every day.
- How to use indicators to help you choose better trades and make smarter trading plans.
- What I think is the best indicator for day trading.
Ready to get to work? Apply for my Trading Challenge here.
My students and I use day trading indicators every day. But we don’t all use the same ones. Trading indicators are unique to each trader and depend on your trading style and strategies. Which indicators are best for you? Read on…
Table of Contents
- 1 What Are Day Trading Indicators?
- 2 Top 3 Day Trading Indicators With Examples
- 3 How to Choose the Best Day Trading Technical Indicators
- 4 How to Use Day Trading Indicators to Make Better Trades
- 5 Which Indicators Do Most Professional Day Traders Use?
- 6 Frequently Asked Questions About Day Trading Indicators
- 7 What Are the Best Indicators for Day Trading?
- 8 Do You Need Indicators to Day Trade?
- 9 Which Technical Indicators Are the Most Accurate to Trade Penny Stocks?
- 10 Which Technical Analysis Is the Best for Day Trading?
- 11 What Is the Best Trend Indicator?
- 12 Day Trading Indicators: The Bottom Line
What Are Day Trading Indicators?

Day trading indicators are tools traders use to help determine potential entries and exits for trades. They can also help traders make better trading plans by showing important information like the following…
- A stock’s trend
- Whether a stock has momentum
- A trade’s potential profits
- Where to cut losses if a trade doesn’t work
Indicators won’t tell you exactly what a stock will do. And they’re not an exact science. But if you know how to use them, they can add conviction to your trades … They can help confirm your trade idea or show you it’s not working.
Let’s dig deeper into day trading indicators so you can determine which one will work best for you and your strategies.
Want to learn the day trading strategies that helped me make over $7.2 million in trading profits?* Start with my FREE penny stock guide.
What’s the Best Day Trading Indicator?

Every trader has an opinion on the best indicator for day trading.
Here’s what I think…
The best indicator for day trading is the one that works best for YOU.

Think about it. A short seller could look at different indicators than a long-biased trader. Same goes for listed stocks vs. OTCs. Indicators aren’t one size fits all.
Test to see what works best with your trading style and strategies. Maybe you won’t like any. That’s OK…
I don’t use many indicators in my trading. I like simple candlestick charts.
One indicator I consider the most important when looking for stocks to trade is big percent gainers.
I know. It’s not an indicator in the traditional sense. It doesn’t show up on the chart or give you an idea of where to buy or sell. But I think it’s the biggest indicator of whether a stock has the potential for a trade. If you day trade, look for big percent gainers.
My students and I look for big percent gainers every day.
Want the full trading education all my top students received? Apply to join my Trading Challenge today. Students get access to video lessons, my DVDs, daily watchlists, and the Challenge chat room.
You’ll also get weekly live trading and Q&A webinars with me and Challenge mentors — like Matt Monaco, Mike “Huddie” Hudson, Jack Kellogg, and Tim Lento. (Lento recently made over $400,000 on a single trade. That brought him over $1 million in trading profits!* Check it out here.*)
Fair warning — I don’t accept everyone. If you’re truly dedicated — apply today.
How bad do you want success? YOU tell me! Will you study videos, blog posts, books, DVDs & webinars when the markets are closed? Will you review your @StocksToTrade scans nightly to be better prepared for trading the next day?!??! YOU CHOOSE YOUR ODDS BASED ON YOUR DEDICATION!
— Timothy Sykes (@timothysykes) August 10, 2021
Top 3 Day Trading Indicators With Examples
Here are three day trading indicators my top students and I use every day…
Support and Resistance
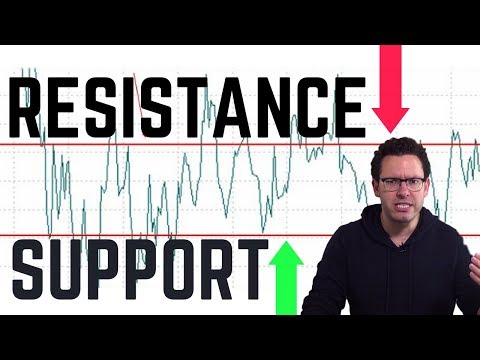
Support and resistance levels are some of the only indicators I use in my trading. They’re technical price levels on a chart created by the stock’s past movements.
ALWAYS study the past!
Before you plan ANY trade, look back at the stock’s chart. Look at multiple time frames…
Look for the price level where it struggles to make new highs. See where dip buyers come in to support it. Those are support and resistance levels. They’re what I base two of my favorite patterns on.
Here’s a chart with support and resistance lines added in. They’re similar to the Fibonacci retracement indicator. (More on that later.)

Breakouts happen when a stock breaks above a former resistance level on the daily chart. They can be powerful moves as traders flood in hoping to ride the upward momentum. Especially if it’s a breakout to new all-time highs with a catalyst. You never know how high the stock can go.
When I dip buy morning panics, I look for the stock to find a support level — a price on the chart where buyers have held it up before. Then I confirm if the level will hold by watching Level 2 action.
If the support level fails and the stock drops below it, I cut losses quickly.
Volume
Volume is one of the most common and important trading indicators. You can’t even open a chart without the volume indicator shown along the bottom — that’s how important it is.
Volume tells you how many shares the stock has traded throughout the day. You can check any given day in the past if you look at a daily chart.
If you trade ultra-low-priced or sub-penny stocks, you should also look at the dollar value of trades. Because these stocks are so cheap, traders usually buy larger positions. That can make it look like it’s traded a lot of volume, but it could be one trader buying or selling a large position.
On this chart, you can see the volume bars along the bottom, and the orange line is the VWAP.

Volume-Weighted Average Price (VWAP)
Personally, I don’t use VWAP. I don’t think it works well with sub-penny or penny stocks. And low-priced OTC stocks are what I love to trade…
But many of my students trade listed stocks. And they love using VWAP.
VWAP stands for volume-weighted average price. It’s a line plotted on the chart that shows the average price the stock traded at throughout the day based on volume and price.
It can give you an idea of the stock’s trend. If the stock is trading above VWAP, it can be a sign that long traders are in control. If the stock’s trading below the VWAP it can mean the shorts are in control.
Again, indicators aren’t an exact science. But they become self-fulfilling prophecies when enough traders believe in them.
If enough traders think the indicator’s important, then it is.
Top Challenge trader Tim Grittani started with only $1,500 and has now made over $13.5 million over his career trading penny stocks.* Check out this video to see how he uses VWAP and other indicators…
How to Choose the Best Day Trading Technical Indicators
Like I said earlier, the best day trading indicator is the one that works best for you. Nobody can tell you which one is best. You’ll have to try them out for yourself…
Don’t have enough experience to know which indicator works best for you?
Try paper trading. It’s how you can test multiple trading indicators without having to risk hard-earned cash.
StocksToTrade has a paper trading feature built into the platform.** It also has all the day trading indicators you need. Plus, built-in scans, watchlists, and a news and social media feed.
Try a 14-day trial of StockToTrade now for only $7. Or get it with the Breaking News Chat add-on feature for only $17.
The Breaking News Chat has been a game-changer for my trading. It alerts me to penny stock news FAST. Then I can make trading decisions and plans to capitalize on potential spikes.
StocksToTrade also has a daily newsletter geared toward traders — Market Grind. Sign up to get top market news delivered to your inbox every trading day.
How was your weekend, did you manage to get in some studying too? Have you reviewed your @StocksToTrade scans for tomorrow yet? Finish your watchlist yet? PREPARATION IS THE KEY TO SUCCESS SO PREPARE, PREPARE, PREPARE!!!! Tomorrow it’s onnnnnn!
— Timothy Sykes (@timothysykes) August 15, 2021
How to Use Day Trading Indicators to Make Better Trades
Once you find the best indicator for your strategy, you can use them to help you plan entries and exits. They can also help spot a stock’s potential trend. Or they might signal an adjustment to your trading plan.
You can also use indicators to spot levels where you should cut losses. Go back and review my support and resistance level example from earlier.
When a stock reverses and changes trends, you have to react fast. That’s why you have to use the right indicators for your strategy. You need to trust them when they show you it’s time to get out.
It takes a lot of practice.
Combine Multiple Day Trading Indicators
No day trading indicator will be right 100% of the time.
It’s up to you to put ALL the indicators together to determine whether a trade is a good fit for you and your strategy.

Line up multiple trading indicators … I don’t mean just your chart indicators. Go over everything that could affect or impact your trades and mindset.
I created my Sykes Sliding Scale to help traders do just that…
It’s a list of seven key indicators traders should look at when planning a trade. And not all of them have to do with the stock or the chart. Think of the big picture…
Consider everything from your personal schedule, to the time of day, and the overall market environment. (Learn more about the Sykes Sliding Scale in my “Trader Checklist Part Deux” DVD.)
Personally, I like to think of myself as a retired trader. I only want to come out of retirement for absolutely perfect setups. That means multiple indicators line up and make it impossible to ignore the trade.
Which Indicators Do Most Professional Day Traders Use?

I already shared three indicators my students and I use every day. But penny stocks are simple. I don’t think you need a lot of indicators to trade them.
If you trade choppy listed stocks, try different indicators and see what you like. Some of the most common ones are:
They all have their own purpose … Moving averages are similar to the VWAP. They show you the average price a stock trades for over a certain time frame.
Bollinger Bands combine moving averages and standard deviations to show you a stock’s trading range. The RSI shows you when a stock could be overbought or oversold and could be due for a reversal.
And Fibonacci retracements are support and resistance levels based on ratios created with numbers in the Fibonacci sequence.
Here’s what it looks like with a nine-day moving average, Bollinger Bands, RSI, and Fibonacci retracements all on one chart:

As you can see, using multiple indicators can clutter the chart. That makes it hard to read the candlesticks — and why I prefer to keep things simple.
Frequently Asked Questions About Day Trading Indicators
Let’s look at some FAQs about day trading indicators…
What Are the Best Indicators for Day Trading?
It’s important to use the trading indicators that work with your trading style and strategies. What works for one trader won’t work for another. Paper trade to test different indicators and discover which work best for you.
Do You Need Indicators to Day Trade?
You don’t need indicators to day trade. But they can help newer traders determine potential entries and exits, spot trends, and make smarter trading plans.
Which Technical Indicators Are the Most Accurate to Trade Penny Stocks?
There’s no magical trading indicator that will tell you when to buy or sell a stock. You have to put in the time and hard work to learn the market’s nuances and how stocks move. Then you can combine that knowledge with indicators that work best for your strategies.
Which Technical Analysis Is the Best for Day Trading?
There’s almost an unlimited number of indicators day traders can choose from. Personally, I like simple support and resistance levels. That’s what works best for my strategies. You have to find what works best for you.
What Is the Best Trend Indicator?
You should combine multiple indicators to determine the trend of a stock. I like to use price action and Level 2 to spot support and resistance levels. If I think a stock could be reversing, I get out. Learning how to read indicators, Level 2, and price action takes a lot of practice.
Day Trading Indicators: The Bottom Line
Day trading indicators can help traders gauge a stock’s trend and momentum. They can also help you spot good entries and exits for trades.
But no indicators are perfect.
And each trader has to choose their own trading indicators based on their preferences. Try out several to find what you like.
I don’t use many chart indicators in my trading. I like big percent gainers with high volume. And when I’m in a trade, I watch support and resistance levels, candlesticks, and Level 2. That’s what works for me.
If you want to learn from my 20+ years of experience trading penny stocks, apply for my Trading Challenge. It’s where all my 14+ millionaire students built their strategies.*
Students get access to all my top trading education resources. Learn the process, mindset, and trading rules you need to become a self-sufficient trader today. Apply here. I’ll see you in the chat room!
What are your favorite day trading indicators? Let me know in the comments … I love to hear from you!
Disclaimers
*This level of successful trading is not typical and does not reflect the experience of the majority of individuals using the services and products offered on this website. From January 1, 2020, to December 31, 2020, typical users of the products and services offered by this website reported earning, on average, an estimated $49.91 in profit.
While Tim Sykes has enjoyed remarkable success trading stocks over the years, earning an aggregate sum of over $7 million in trading profits between 1999 and 2021, his primary income derives from the sale of financial education products and subscription services offered by various businesses and websites in which he has an ownership stake.
**Tim Sykes has a minority ownership stake in StockstoTrade.com.

Leave a reply