The shooting star candle is a formation traders use to trade volatility. It’s when the price of a stock spikes higher but then falls back down and closes near the open.
To understand this pattern, you’ve got to understand candle stick charts first.
But don’t worry, candlesticks are easy to understand. I’ve got a guide right here.
Some people try to trade stocks with line charts … they don’t last very long.
Line charts don’t show as much price data as a candlestick chart. And traders use that price data to find popular trade setups.
I have over 30 millionaire students and none of them use line charts.
In this industry, we need a certain amount of data to make informed decisions.
Candlesticks are a necessity. In fact … there are a lot of things new traders need to know.
That’s why I’m here. Using this process, I’ve raked in over $7.4 million in trading profits and helped over 30 students reach the $1 million milestone.
I can help you too.
Here’s what you need to know about the shooting star candle …
Table of Contents
- 1 What Is a Shooting Star Candle?
- 2 Understanding the Psychology Behind Shooting Star Candlestick Pattern
- 3 How to Identify a Shooting Star Candlestick Pattern
- 4 How to Trade the Shooting Star Candlestick Pattern Successfully
- 5 Examples of How to Use the Shooting Star Candle
- 6 Advantages and Limitations of the Shooting Star Candlestick Pattern
- 7 Key Takeaways
- 8 FAQs
- 8.1 Is There a Bullish Shooting Star Pattern?
- 8.2 How Accurate Is the Shooting Star Pattern?
- 8.3 What Is the Best Indicator for Shooting Star Candle Strategy?
- 8.4 What Are the Key Candlesticks Patterns To Watch For in a Downtrend?
- 8.5 How Can I Learn More About the Shooting Star Candle Pattern?
- 8.6 What Are the Common Market Behaviors That Traders Track Using the Shooting Star Candle?
- 8.7 How Is the Shooting Star Candle Pattern Interpreted in Different Cases?
- 8.8 What Steps Should I Take To Incorporate the Shooting Star Candle Pattern Into My Stock Trading Strategy?
- 8.9 How Does the Shooting Star Candle Pattern Fit Within the Same Technical Analysis Framework As Other Patterns?
- 8.10 How Can I Ensure the Security of My Trading Account When Trading Based on the Shooting Star Candle Pattern?
- 8.11 Can the Shooting Star Candle Pattern Be Associated With Order Placement?
- 8.12 How Can the Idea of a “Shooting Star” in Space Connect Metaphorically to the Shooting Star Candle Pattern in Trading?
- 8.13 What’s the Connection Between the Shooting Star Candle Pattern and the Celebration of a New Year’s Eve Party or Other Holidays Like Christmas?
What Is a Shooting Star Candle?

A shooting star candle is a type of candlestick pattern that signifies a potential reversal in the market trend.
It’s typically found at the end of an uptrend, and its formation is marked by a small body with a long upper wick or shadow. Traders see it as a sign of exhaustion from the buyers.
Origin and History of the Shooting Star Candle

The shooting star pattern has its origins in Japanese candlestick charting techniques dating back to the 17th century.
It’s one part of a broader trend analysis method that is still highly relevant today. The historical use of this pattern emphasizes its effectiveness in predicting market reversals.
Characteristics and Observations of a Shooting Star Candle
The shooting star candle is characterized by a small body, a long upper shadow, and little or no lower wick.
Its appearance at the end of an uptrend is an essential observation, as it symbolizes the loss of momentum from the buyers and a possible shift in control to the sellers.
That means it’s a decent signal to sell your bullish position.
One of the most important things I show all my students is where the buy and sell signals are.
We need to understand both to create an effective trade plan.
If you’re interested in this niche …
This is where all my millionaire students started.
There’s a specific process we use for success.
I can show you everything you need to know.
Red or Green Shooting Star Candlestick. What’s the Difference?
The color of a shooting star candle is secondary to its shape.
A green or red body can form a shooting star, and the color does not significantly impact the pattern’s efficacy.
What’s crucial is the small body, long upper shadow, and the place in the existing trend where it occurs.
Understanding the Psychology Behind Shooting Star Candlestick Pattern
The psychology of the shooting star is based on market sentiment.
The long upper wick symbolizes an attempt by buyers to push the price higher, but they fail to maintain it, resulting in a close near the open.
This failure can instill fear and uncertainty among traders.
This is just one piece of the trading puzzle.
To fully grasp the dynamics of the market, it’s essential to familiarize yourself with other patterns and indicators.
For a deeper dive into these concepts, check out this guide on bearish engulfing candles, another crucial pattern to recognize.
How to Identify a Shooting Star Candlestick Pattern

Recognizing a shooting star candle requires more than a quick glance at a chart.
It’s a careful examination of various elements, including the length of the upper wick and the position within the trend.
You also need to be able to identify what a shooting star candlestick pattern isn’t.
In the universe of candle stick patterns, there are a lot of different strategies and formations.
For example, understanding the concept of selling the news is valuable context when examining any chart pattern.
It refers to the phenomenon where a stock’s price decreases despite positive news reports. Understanding such concepts can significantly enhance your trading acumen.
Guide to Understanding Shooting Star Candlestick Patterns
Understanding a shooting star entails recognizing its size, position, and confirmation with the next candle.
Look for it at the end of an uptrend, followed by a bearish confirmation candle. Its presence is an opportunity to possibly capitalize on a trend reversal.
How to Spot Resistance With Shooting Star Patterns
Spotting resistance with a shooting star means looking at where the price stops climbing.
If you’re unfamiliar with support and resistance, now is a great time to get acquainted …
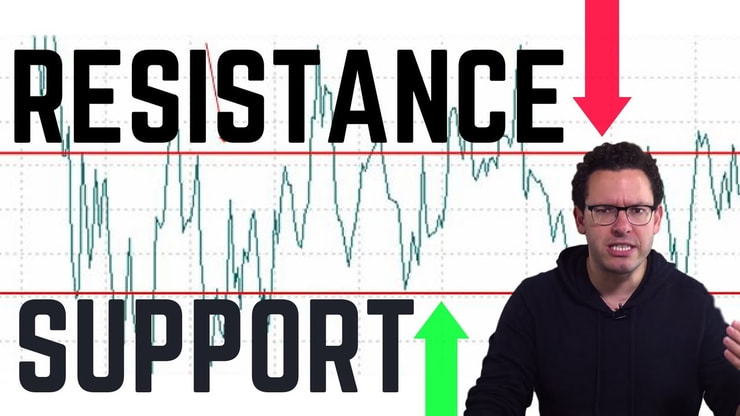
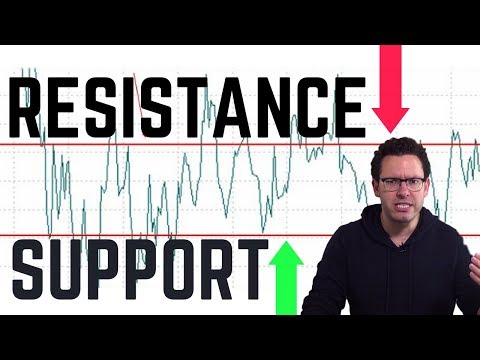
The long upper shadow shows where the buyers lost control, and this level may become future resistance. It’s a valuable piece of information to identify potential selling opportunities.
How to Trade the Shooting Star Candlestick Pattern Successfully

Trading the shooting star pattern is a blend of art and science.
It’s not about merely seeing the pattern but about understanding the market conditions and applying risk management strategies.
In addition to the shooting star, there are other patterns and indicators that can provide valuable insights.
For instance, understanding the dynamics of a bull trap can help you avoid false signals of an upward trend.
Always remember, the more tools you have in your trading toolkit, the better prepared you’ll be to navigate the market’s twists and turns.
Trade Entry
When it comes to trade entry with a shooting star, patience is key.
Wait for a confirmation candle before entering the trade. The confirmation could be a strong bearish candle following the shooting star, signifying the start of a potential downtrend.
Setting Your Stop Loss
Setting a stop loss is about controlling the risk.
Day trading can lead to substantial losses. A 2019 study called “Day Trading for a Living?” looked at the success rates of Brazilian traders over a 2-year window, and found that 97% of traders with more than 300 days of active trading lost money. Only 1.1% earned more than the Brazilian minimum wage — that’s only $16 per day!
That’s why we use stop losses …
For a short selling position, place it above the high of the shooting star, ensuring that if the trade goes against you, the loss is limited.
A well-placed stop loss is a critical tool in a trader’s strategy.
Profiteering or Taking Profits
Knowing when to take profits is just as vital as recognizing the entry point.
Look at previous support levels, and trend lines, or use tools like oscillators to identify potential profit-taking zones. It’s a science as much as it’s an art.
There are different profit points for each strategy.
Make sure to use the most popular strategy for the market we’re in. Like the patterns I highlight in my recent video …
SUCH AN IMPORTANT AND FREE VIDEO LESSON: https://t.co/9NkckqsYay The Reliable Patterns That Make Millionaire Stock Traders….LEARN THIS NOW AND THANK ME LATER!
— Timothy Sykes (@timothysykes) August 10, 2023
Keep reading to understand when we should pay attention to a shooting star candle.
Examples of How to Use the Shooting Star Candle

The shooting star candle is not just a stand-alone signal.
It’s part of a broader strategy that can be applied in various market situations.
But to effectively trade these strategies, we must use up-to-date price data. Most chart software online displays market data 10 – 20 minutes late. That’s why I helped design StocksToTrade.
It’s made specifically for small-account traders that want to profit off huge runners.
Try the 14-day trial of StocksToTrade for just $14.
Now let’s get to the strategies.
Shooting Star Candle Trading Strategies
Integrating shooting stars into your trading strategies means recognizing the pattern and combining it with other indicators or methods.
For example, using the shooting star along with volume analysis can provide additional confirmation.
Shorting Rallies in a Downtrend
A shooting star in a downtrend, especially at a known resistance level, can be an excellent opportunity to short.
It signifies a potential continuation of the downtrend and, combined with other analyses, can form the basis of a successful trade.
Shorting the Upper Boundary of a Ranging Market
A shooting star at the top of a range can signal a move back to the lower part of the range.
It’s a sign that the buyers couldn’t maintain control, and the sellers might be stepping in.
Trading Bearish Reversal Chart Patterns
Trading bearish reversal chart patterns with a shooting star involves careful analysis of the market’s overall trend.
The presence of a shooting star at the end of an uptrend can indicate a change in the wind. Pair it with confirmation candles and other tools like oscillators to validate the reversal signal.
Advantages and Limitations of the Shooting Star Candlestick Pattern

While powerful, the shooting star pattern has both strengths and weaknesses …
Benefits of Shooting Star Candle Pattern
The shooting star candle offers a visually striking sign of a potential trend reversal.
It can be an excellent signal to consider short positions. With the right context and confirmation, it can be a reliable part of your trading toolkit.
Limitations of the Shooting Star Candle Pattern
No pattern works 100% of the time, and the shooting star is no exception.
Its appearance doesn’t always lead to a reversal, and it must be used in conjunction with other analysis tools. Always consider the broader market context.
Key Takeaways

The shooting star candle is a potent reversal pattern, often found at the end of an uptrend.
It must be recognized with care — looking at the long upper wick, position within the trend, and confirmation.
Trading the shooting star requires a comprehensive strategy, including entry, stop loss, and profit-taking measures.
Like any other pattern, it’s not foolproof and should be used with other tools and analyses.
Trading isn’t rocket science. It’s a skill you build and work on like any other. Trading has changed my life, and I think this way of life should be open to more people…
I’ve built my Trading Challenge to pass on the things I had to learn for myself. It’s the kind of community that I wish I had when I was starting.
We don’t accept everyone. If you’re up for the challenge — I want to hear from you.
Apply to the Trading Challenge here.
Trading is a battlefield. The more knowledge you have, the better prepared you’ll be.
Do you use the shooting star candle in your trading strategy? Let me know in the comments — I love hearing from my readers!
FAQs
Is There a Bullish Shooting Star Pattern?
No, the shooting star is typically a bearish pattern.
However, its bullish counterpart, known as the inverted hammer, has similar characteristics but appears at the end of a downtrend.
How Accurate Is the Shooting Star Pattern?
The accuracy of the shooting star pattern depends on its context, confirmation, and the trader’s overall strategy.
It’s not a standalone signal but part of a broader analytical framework.
You can’t enter a position, make a wish, and then fall asleep and wake up to profits under your pillow. That’s a dream.
In order to use the shooting star candle effectively, it takes a bit of work and attention.
What Is the Best Indicator for Shooting Star Candle Strategy?
There’s no one-size-fits-all answer here. Different traders might use the shooting star pattern with various other indicators like trend lines, volume, or oscillators.
What works best will depend on individual strategies and the market being traded.
What Are the Key Candlesticks Patterns To Watch For in a Downtrend?
In a downtrend, traders often look for specific candlestick patterns such as the Shooting Star, Gravestone Doji, and other bearish signals.
These patterns, combined with other technical analysis forms, can indicate potential reversals in stocks or forex markets and help identify potential highs and lows in prices.
How Can I Learn More About the Shooting Star Candle Pattern?
You can access various content on the Shooting Star Candle pattern through articles, webinars, and online courses.
Check the site of your preferred financial education provider for more information, and make sure to consult with a legal or financial professional if you need personalized advice.
What Are the Common Market Behaviors That Traders Track Using the Shooting Star Candle?
Traders often use the Shooting Star Candle to track market behaviors like volatility, potential rallies, and distribution phases.
This pattern can help identify when the bulls may lose control, and a bottom may form, which can indicate losses or gains in various group of stocks or other markets.
How Is the Shooting Star Candle Pattern Interpreted in Different Cases?
In various cases, the Shooting Star Candle pattern may be interpreted differently.
This pattern’s significance may vary based on share volume, broader market trends, and other entities in the technical analysis section.
Traders must consider all these factors to make accurate decisions.
What Steps Should I Take To Incorporate the Shooting Star Candle Pattern Into My Stock Trading Strategy?
Incorporating the Shooting Star Candle pattern into stock trading requires careful planning and analysis.
The initial steps might include understanding the pattern, back-testing it against historical data, evaluating its performance during different market conditions, and consulting with a financial advisor if necessary.
How Does the Shooting Star Candle Pattern Fit Within the Same Technical Analysis Framework As Other Patterns?
The Shooting Star Candle pattern is one of many candlestick formations used in technical analysis.
It follows the same general principles and is interpreted alongside other patterns to understand the overall market direction.
Its unique formation helps traders identify potential reversals in a rally or downtrend during a particular trading session.
How Can I Ensure the Security of My Trading Account When Trading Based on the Shooting Star Candle Pattern?
Securing your trading account is essential, especially when following specific trading strategies like those involving the Shooting Star Candle pattern.
This process may include employing strong passwords, enabling two-factor authentication, and following best practices in cybersecurity law and regulations.
Also, stop losses can help [protect your account from unnecessary losses.
Can the Shooting Star Candle Pattern Be Associated With Order Placement?
Yes, the Shooting Star Candle pattern can influence order placement in trading.
When this pattern is identified, traders may decide to place a sell order if they anticipate a price drop or a buy order if the pattern forms at the end of a downtrend, indicating a potential upward rally.
How Can the Idea of a “Shooting Star” in Space Connect Metaphorically to the Shooting Star Candle Pattern in Trading?
The concept of a shooting star in space, often associated with universal phenomena like meteors falling through the night sky, parallels the Shooting Star Candle pattern’s fleeting appearance in a trading session.
Both are ephemeral and in the context of trading, the pattern’s occurrence might be seen as a rare, short-lived opportunity for profit.
What’s the Connection Between the Shooting Star Candle Pattern and the Celebration of a New Year’s Eve Party or Other Holidays Like Christmas?
While it might seem unrelated, the Shooting Star Candle pattern’s appearance could be likened to the sparkle of lights, smoke, and flame at a holiday celebration like a New Year’s Eve party, Christmas gathering, or a birthday.
Just as these events mark transitions and new beginnings, the pattern can signify a potential turning point in market trends.
This metaphorical connection adds a cultural layer to understanding this complex trading concept but should be taken in a light-hearted context and not influence trading decisions.

Leave a reply