
The triangle pattern is used in technical analysis. It connects more distant highs and lows with closer highs and lows. The pattern shows either consolidation or increased volatility, depending on its orientation.
So you want to learn about popular trading patterns …
The fact that you clicked on this article is a sign you’re unique.
Most people just want hot stock picks. Honestly, very few people are interested in chart patterns.
I guess it’s too much work for them.
But it seems like you already understand there’s a systematic approach to trading. One that follows history and science, instead of gut feeling. That’s why you’re reading this.
Here’s the key: The stocks I trade are highly volatile. And that makes them predictable during certain periods.
People behave predictably when they’re stressed. Like when a stock is up 100% on the day and they’ve got their kid’s college fund on the line.
Some people are gambling with these big spikers. Not me. I’m interested in consistent profits.
That’s why I follow patterns.
That’s how I’ve traded for more than two decades. And I’m sitting at more than $7.4 million in trading profits right now.
There were some losses along the way, but I learned to control them. Always protect the account.
There’s another trade to make right around the corner. So I’m never worried about a trade that doesn’t go my way.
And luckily, the patterns tell me when to buy and sell.
You’ll understand after you read about the triangle pattern …
Table of Contents
- 1 What Is a Triangle Pattern in Trading?
- 2 How To Identify the Different Triangle Patterns
- 3 How To Trade the Different Triangle Patterns
- 4 Key Takeaways
- 5 Frequently Asked Questions (FAQs)
- 5.1 Is a Symmetrical Triangle Pattern Bullish or Bearish?
- 5.2 What Is the Difference Between Pennant Patterns and Symmetrical Triangles?
- 5.3 How To Find a Take-Profit Target When Trading the Symmetrical Triangle Pattern?
- 5.4 How Reliable Is a Descending Triangle Pattern?
- 5.5 When Is a Descending Triangle Bullish?
- 5.6 Does the Descending Triangle Work?
- 5.7 How Are Triangle Chart Patterns Used in Trading?
- 5.8 What Tools Are Used To Illustrate Triangle Patterns?
- 5.9 How Can Investors Approach Triangle Patterns?
- 5.10 How Does the English Language Impact Trading Documentation?
- 5.11 How Can Brokers Utilize Hand-Drawn Triangle Patterns?
What Is a Triangle Pattern in Trading?

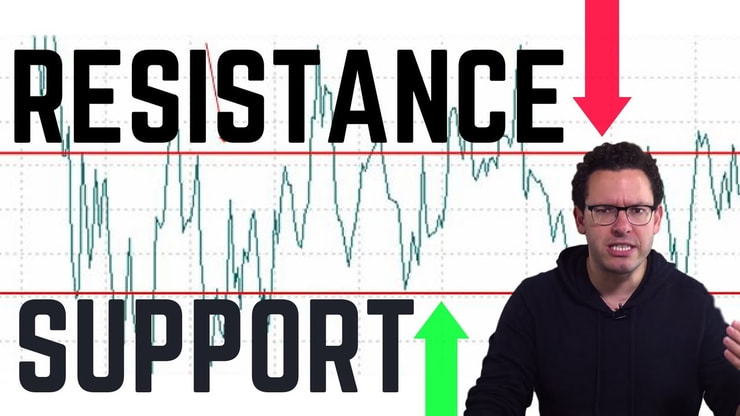
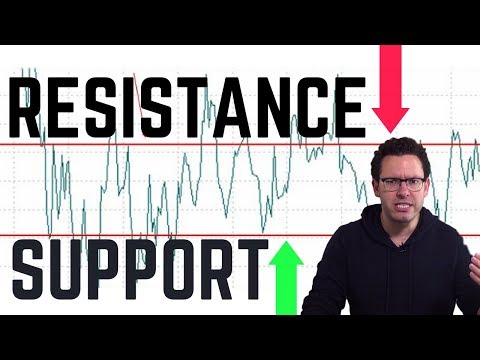
A triangle pattern often signals a trend continuation or reversal. They consist of support and resistance lines, where the price action occurs between these levels.
The three sides form an equal length, representing the struggle between bulls and bears.
The type of triangle — be it ascending, descending, or symmetrical — guides the trader’s eyes and hands. Each triangle type offers a different perspective and a different path. The angles and the base, whether obtuse or acute, all reveal the underlying market conditions.
Let’s delve into the details of each type.
Triangles can be your guiding star in the volatile landscape of trading. They are not just transparent illustrations but are a hand-drawn roadmap for potential breakouts or breakdowns.
As a trader, you’ll find these geometric shapes to be a cornerstone of technical analysis. Knowing them is a solid start in your trading journey.
But they’re not the only patterns we use.
Every trader is different. Depending on your strengths and weaknesses, a different pattern might speak to you more clearly in the beginning.
I share all of my trading patterns in the Trading Challenge. I think that’s why all my millionaire students came from the Challenge.
If you’re interested in this niche, there’s no better place to continue your trading journey …
>> Apply to join the Trading Challenge today <<
Definition of a Triangle Pattern and Types

A triangle pattern isn’t just another polygon like a quadrilateral or hexagon; it’s a specific series of highs and lows, connecting each other in a trendline.
From the obtuse descending triangle to the acute ascending one, each shape tells a story. These formations are not just simple designs but are part of a trader’s essential toolkit.
These patterns can be scalene, where no sides are equal, or isosceles with two parallel sides. Their formation is a reflection of market forces, like support level and resistance line, coming together.
The right type of triangle, positioned well, signals either continuation patterns or reversal movements in price trends.
Triangles are more than angles and sides; they’re a detailed collection of information on how buyers and sellers interact. Whether it’s the apex that signifies the beginning or the base that defines the range, understanding the types is the key to decoding the market’s language.
What Does a Symmetrical Triangle Pattern Look Like?

A symmetrical triangle is a beautiful geometric shape with equal angles and sides. In trading terms, it’s a sign of a pause, a moment of consolidation before a resumption.
Its two trendlines converge towards each other, forming a pattern where both the support line and resistance line are sloping towards each other.
This pattern is often seen as an opportunity in the market, a rainbow of possibilities waiting to break out in either direction.
Unlike an obtuse or right triangle, its lines are converging, creating an apex point. It’s a simple yet colorful texture in the fabric of trading charts.
The symmetrical triangle is more than a licensable wallpaper in the trading world; it’s a sign, a result, a chance. It stands tall between other shapes like wedges and pennants, offering a unique way to understand the price movement in stocks, forex, or crypto.
What Is a Descending Triangle Pattern?
The descending triangle pattern is like an obtuse angle, where the resistance line is flat, and the support line is downward sloping.
In terms of trading, this formation is often a bearish sign. Unlike the colorful and seamless design of a symmetrical triangle, this one signals a potential downside move.
It’s not just an abstract modern shape; it’s a gradient in the trading world that may indicate the bears taking control. The pattern often leads to a breakdown in prices, offering an opportunity for those who understand its language.
The descending triangle isn’t just another random polygon; it’s a powerful guide, a head above the shoulders in the realm of trading patterns.
Knowing this pattern is like holding the gleaming yellow key to understanding bearish trends and volatility.
What Is an Ascending Triangle Pattern?
The ascending triangle pattern is like an acute angle, where the resistance line remains flat, and the support line rises to meet it.
It’s a green signal in trading, often pointing to an upside breakout. This formation is more than just a simple border; it’s a teal-colored sign of bullish momentum and a possible uptrend.
Long-biased traders might think about making some trades.
Unlike the obtuse descending triangle, the ascending one has an equal perimeter that illustrates a battle where buyers slowly gain strength over sellers.
It’s a pattern that many traders watch for a bullish breakout.
The ascending triangle isn’t just about the base and altitude; it’s about the hypotenuse of opportunities. It’s a sign that the bulls are gaining ground, that the tide is turning. In the world of trading, this pattern is like a bright green beacon guiding towards potential profits.
And remember, there are a lot of different patterns out there to choose from.
Another good one is the first-green-day pattern. I linked a video tutorial below …


How To Identify the Different Triangle Patterns
Identifying triangle patterns isn’t about a casual glance at colorful shapes; it’s a systematic analysis. It requires attention to details like trendlines, highs, and lows.
The area enclosed within a triangle may look simple, but the information hidden in that space is gold for traders.
And it’s essential we look at price data that’s up to date. Otherwise, our trading pattern could lead us astray.
Understand, free chart software displays data that’s 10 – 20 minutes late …
That’s why every professional trader I know routes their brokerage account through a more capable charting software.
I use StocksToTrade. I helped create it because a decade ago I needed a bunch of different tabs open to make one trade. The workflow was a nightmare!
StocksToTrade is designed for small-account traders …
>> Try a 14-day trial of StocksToTrade for $7 <<
Once you’ve got up-to-date software we can explore the different types of triangles – ascending, descending, or symmetrical – each offer unique signals.
The trendline and angles can signal a continuation pattern or indicate a reversal. A careful look at these shapes opens the door to understanding the market’s next move.
Let’s dissect each triangle pattern and see how to spot them. These are not just hand-drawn illustrations but a set of transparent tools to help you navigate the trading waters.
How To Spot a Descending Triangle Chart Pattern
Spotting a descending triangle isn’t about merely seeing an obtuse angle; it’s about recognizing the risk and formation.
Look for a flat resistance level and a descending support line, creating a shape that leans towards the downside. Analyzing this pattern involves understanding the underlying strength and resistance within the stock or forex market.
If you’re unfamiliar with terms like support and resistance, watch my video below …
Unlike symmetrical triangles with colorful rainbows, descending ones are more blue or grey, signaling caution and bearish tendencies. The border might look simple, but the details within the pattern are a pathway to understanding market trends and potential breakdowns.
This pattern is more than just a random shape; it’s a detailed guide in your trading journey. Understanding the descending triangle means holding a key to potential opportunities in bearish market conditions.
How To Spot the Symmetrical Triangle Chart Pattern
Spotting a symmetrical triangle pattern isn’t just about seeing three equal sides; it’s about understanding the underlying market consolidation.
It requires an eye for trendlines converging towards each other and an ear for what the price action within the pattern is signaling.
This pattern, often seen in stocks, crypto, and forex trading, isn’t merely a colorful abstract design; it’s a sign of an impending breakout or breakdown. The transparent texture of this pattern indicates a pause and potential resumption of the existing trend.
Symmetrical triangles are not just a modern gradient; they’re a hand-drawn map to trading success. They are an essential part of the trader’s toolkit, providing a clear and detailed insight into the market’s movement.
Symmetrical Triangle Patterns: Identification Guidelines
Identifying symmetrical triangle patterns is not about merely sketching an equilateral triangle; it’s about recognizing the market’s pause and preparation.
This pattern, with its converging trendlines and equal angles, offers guidance in spotting a potential continuation pattern or reversal.
Look for two trendlines that are sloping towards each other, creating a narrow range. These are not just random lines but a clear indicator of an impending breakout or breakdown. From stocks to forex, this pattern is a classic signal, a teal-colored opportunity waiting to be explored.
Symmetrical triangles are more than a wallpaper in the world of trading; they’re an essential tool, a pathway, a strategy. Understanding them is like holding a golden key to the treasure of market opportunities.
How To Trade the Different Triangle Patterns

Trading triangle patterns isn’t just about recognizing shapes; it’s about understanding the dynamics of price action, trend, and breakout within those formations. These patterns, whether ascending, descending, or symmetrical, offer a chance to position yourself well in the market.
Triangles in trading aren’t just abstract designs; they are a collection of opportunities and signals.
From buy to sell, from bulls to bears, each pattern offers a unique pathway. Let’s delve into the tools and techniques to trade these colorful geometric shapes.
Triangles aren’t merely about angles and sides; they’re about applying technical analysis and utilizing the strength and signals within those shapes. Knowing how to trade them offers an advantage in the trading world.
How To Trade With the Symmetrical Triangle Pattern
Trading with a symmetrical triangle pattern isn’t just about recognizing three equal sides; it’s about understanding the underlying consolidation and positioning yourself for a potential breakout. This pattern, often seen in stocks and crypto, signals a pause, an opportunity to enter the market at the right time.
Look for converging trendlines and use indicators like the relative strength index to guide your entry and exit points. Trading this pattern is not just a random act; it’s a calculated approach that offers a range of possibilities.
Symmetrical triangles are more than a colorful design; they’re a pathway to profits. Trading them requires attention to detail, a strong sense of market conditions, and an understanding of the underlying price trend.
How To Trade a Descending Triangle
Trading a descending triangle isn’t just about spotting an obtuse angle; it’s about understanding the underlying bearish sentiment.
This pattern, characterized by a flat resistance line and a downward-sloping support line, is often a sign of a potential breakdown in prices.
Use tools like trendlines and technical analysis to guide your trading decisions. Recognize the strength of the bears and position yourself for a potential downside move. This pattern is not just an abstract shape; it’s a systematic approach to trading.
Descending triangles are more than a random geometric form; they’re a signal, a guide, a chance. Knowing how to trade them offers an advantage in bearish market conditions.
How To Trade an Ascending Triangle
Trading an ascending triangle isn’t just about recognizing an acute angle; it’s about understanding the bullish momentum building within the pattern. This formation, characterized by a flat resistance line and an upward-sloping support line, signals a potential upside breakout.
Using tools like trendlines and price movement analysis, you can position yourself for a profitable trade.
Recognize the underlying strength of the bulls and be prepared for a potential upward move. This pattern is not just a simple shape; it’s a colorful texture woven into the fabric of trading.
Ascending triangles are more than a random polygon; they’re a pathway, an opportunity, a sign. Understanding how to trade them puts you at an advantage in bullish market conditions.
Pros & Cons of Trading Triangle Patterns
Trading triangle patterns is not a black-and-white affair; it’s about understanding the grey areas, the pros and cons. Recognizing the shapes and angles is one part; understanding the underlying price action, trend, and breakout potential is another.
Pros of trading these patterns include a clear signal of continuation or reversal, and the ability to set clear targets and stop losses. Cons include potential failure, misinterpretation, and volatility that might occur around breakouts.
Triangle patterns aren’t just a random collection of lines; they’re a carefully crafted guide to trading. Knowing the pros and cons is not just a part of the trading journey; it’s an essential aspect of a well-informed trading strategy.
Key Takeaways

Triangles in trading are more than just a series of lines; they’re a comprehensive guide to understanding market movements, breakouts, and reversals.
Understanding and trading them isn’t merely about recognizing shapes; it’s about using tools, analysis, and insight to capitalize on opportunities.
Recognize the different types of triangles, from ascending to descending to symmetrical, and understand the underlying price action and signals they offer. These aren’t just random shapes but a clear pathway to profitable trading.
Triangles offer opportunities for traders willing to delve into the details, understand the underlying trend, and utilize tools and analysis. It isn’t a silver bullet for your trading plan — but the triangle pattern is one of many topics you should learn as part of your trading education!
Trading isn’t rocket science. It’s a skill you build and work on like any other. Trading has changed my life, and I think this way of life should be open to more people…
I’ve built my Trading Challenge to pass on the things I had to learn for myself. It’s the kind of community that I wish I had when I was starting out.
We don’t accept everyone. If you’re up for the challenge — I want to hear from you.
Apply to the Trading Challenge here.
Trading is a battlefield. The more knowledge you have, the better prepared you’ll be.
Do you use the triangle pattern in your trading strategy? Let me know in the comments — I love hearing from my readers!
Frequently Asked Questions (FAQs)
Is a Symmetrical Triangle Pattern Bullish or Bearish?
A symmetrical triangle pattern isn’t simply bullish or bearish; it’s about understanding the underlying consolidation. This pattern signals a pause in the trend, and the breakout could be in either direction.
It’s not a colorful abstract design; it’s a transparent signal, an opportunity for traders to recognize the potential continuation or reversal of a trend.
What Is the Difference Between Pennant Patterns and Symmetrical Triangles?
The difference between pennant patterns and symmetrical triangles isn’t merely about different geometric shapes; it’s about the underlying market behavior.
While both signal a pause, pennants are typically shorter-term formations and often result in a continuation of the existing trend. Symmetrical triangles might lead to a continuation or reversal, offering a broader range of opportunities.
How To Find a Take-Profit Target When Trading the Symmetrical Triangle Pattern?
Finding a take-profit target when trading a symmetrical triangle pattern isn’t just about sketching lines; it’s about understanding the height of the pattern and projecting that from the breakout point.
This approach isn’t merely a random act; it’s a systematic way to identify potential profit levels based on the underlying geometry and market conditions.
How Reliable Is a Descending Triangle Pattern?
A descending triangle pattern isn’t just a random obtuse shape; it’s a reliable signal of potential bearish movement.
However, like all trading strategies, it requires careful analysis, an understanding of market conditions, and a well-defined trading plan
It’s not just about recognizing the pattern; it’s about implementing it in a way that aligns with your risk tolerance and trading strategy.
Always remember that day trading can lead to substantial losses.
A 2019 study called “Day Trading for a Living?” looked at the success rates of Brazilian traders over a 2-year window, and found that 97% of traders with more than 300 days of active trading lost money.
Only 1.1% earned more than the Brazilian minimum wage — that’s only $16 per day!
When Is a Descending Triangle Bullish?
A descending triangle isn’t necessarily always bearish; it’s about understanding the underlying context.
In certain market conditions, it might signal a bullish reversal, especially if the pattern forms after an extended downtrend. It’s not a simple black-and-white shape; it’s a nuanced pattern that requires an in-depth understanding of trend direction and market analysis.
Does the Descending Triangle Work?
The descending triangle pattern isn’t just a random geometric formation; it works as a trading strategy when used correctly.
Recognize the pattern, apply proper risk management, and use it in conjunction with other technical analysis tools. Like all strategies, it’s not foolproof, but with careful application, it offers a pathway to potential profits.
How Are Triangle Chart Patterns Used in Trading?
Triangle chart patterns are used to identify the continuation or reversal of trends within a trading range.
They come in different forms, such as ascending, descending, and symmetrical triangles.
Examples include observing the triangle formation in a bullish or bearish market, where the pattern’s shape and volume may indicate future price movements.
What Tools Are Used To Illustrate Triangle Patterns?
Many traders use professional tools like Adobe Illustrator to create hand-drawn illustrations of triangle patterns. They might use vector graphics to ensure scalability and shapes like octagons or pentagons can be employed to depict complex patterns.
Small details can be added to enhance the visualization, aiding in understanding the patterns better.
You might think a highly specialized computer would make these patterns visible. But hand drawn is fine.
How Can Investors Approach Triangle Patterns?
Investors analyze triangle chart patterns by examining the volume, recognizing the trading range, and identifying the bottom of the pattern.
The approach might vary in the case of a breakout or breakdown, where volume changes and the trading range expands or contracts. Understanding these dynamics helps investors make informed decisions.
How Does the English Language Impact Trading Documentation?
The English language is widely used in the trading community and serves as a common medium for explaining concepts such as hand-drawn triangle patterns.
The fact that English is a global language means that companies often use it to communicate complex trading ideas and patterns. This helps ensure that these concepts are accessible to a broad audience of traders, traders, and analysts across different times and regions.
How Can Brokers Utilize Hand-Drawn Triangle Patterns?
Brokers can utilize hand-drawn triangle patterns to visualize market trends and support their trading strategies.
When communicating these patterns to clients, they should consider factors like clarity, relevance, and the client’s level of understanding.
The company’s culture or region might influence the way these drawings are presented, as different areas may have unique preferences or standards for visual communication.

Leave a reply