
Today we’re going to talk about one of the stars in stocks, Alphatrends’ Brian Shannon — and his awesome book, “Technical Analysis Using Multiple Timeframes.”
He dropped his INCREDIBLE work on stocks and the markets into the wasteland of trading books in 2008. It’s still one of the only English-language books on trading that have something real to offer.
The vast majority of finance books are written by marketers, fee-earners, frauds, and talking heads — and sugar coated to DEATH…
It’s rare that a trading book will spark my interest. When it’s actually filled with the kinds of details in its pages that create real winners, it vaults to the top of the hardcover stack!
There’s been nothing like Shannon’s book, before or since. Let’s get to the content, and I’ll tell you the way to incorporate his tips, examples, and other valuable information into your trading strategy.
Table of Contents
What Is Technical Analysis?
Technical analysis is the study of market trends using chart patterns, volume, and price movements. This strategy is used by traders to predict future price movements based on historical data.
Employing technical analysis using multiple timeframes is essential for understanding the nuances of market trends and making more precise trading decisions. Brian Shannon, a seasoned trader and author, developed a unique method known as Squeeze Dynamics Theory that employs technical analysis using multiple timeframes. This approach allows investors to maximize profit and minimize risk in both swing and day trading.
The benefits of technical analysis are numerous. It offers traders insights into market trends, resistance and support levels, and potential entry and exit points for trades. These indicators guide investors in making informed decisions, reducing the element of surprise, and improving the odds of successful trades.
Understanding the intricacies of trading is a continuous journey. The more you delve into the world of trading, the more you realize the importance of technical analysis. It’s not just about analyzing multiple time frames, but also about understanding the underlying principles that govern the market. The basics of technical analysis can provide you with a solid foundation to build upon. As you gain more knowledge, you’ll be better equipped to make informed trading decisions.
Benefits of Technical Analysis
Utilizing multiple timeframes in technical analysis enhances the ability to spot trends and reversals, providing a competitive edge in trading.
I want you to pick up a copy of “Technical Analysis Using Multiple Timeframes” right the hell now and read in awe as Shannon explains how it’s more important to understand how variables, players and emotions align to create shockingly similar, repetitive, and, more importantly, predictable chart patterns.
(Disclosure: I’m a Shannon affiliate so part of your purchase will go to help my sushi habit and I’m damn proud to have finally found a friggin’ finance product worthy of my unabashed-promotional-at-all-times-big-mouth… aka I’ll never promote anything this hardcore that I really don’t believe to be useful/helpful/worth its cost many times over.)
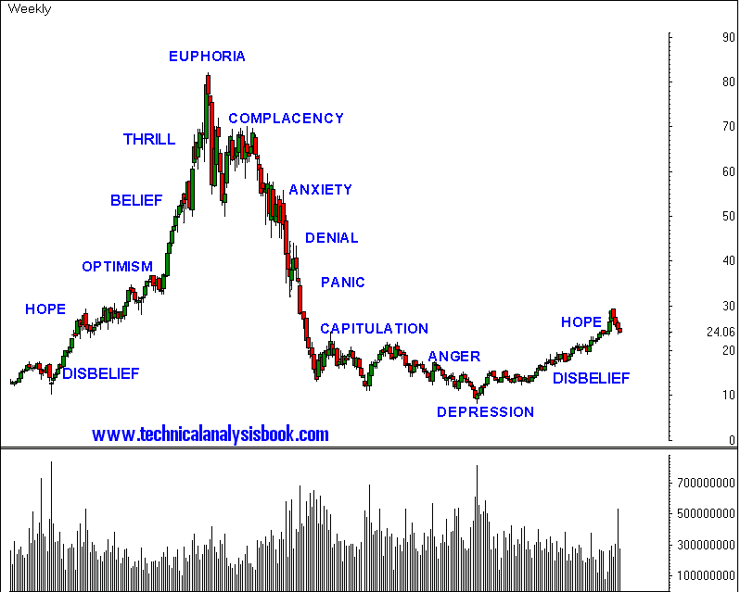
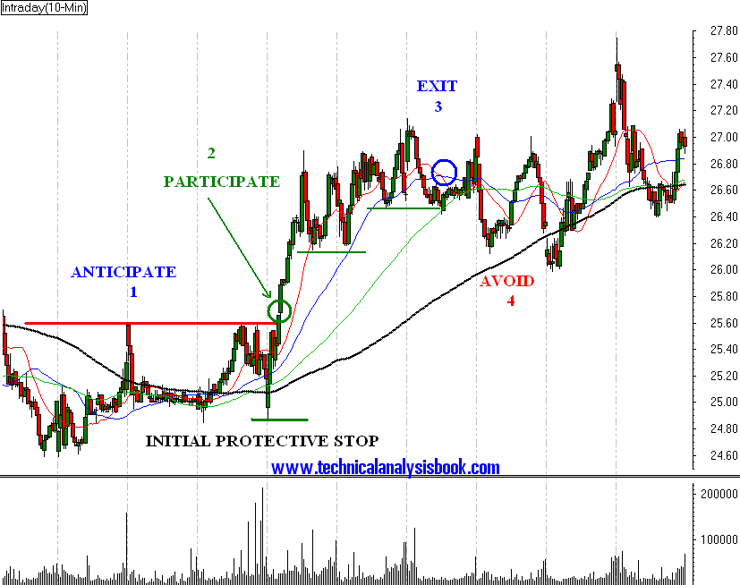
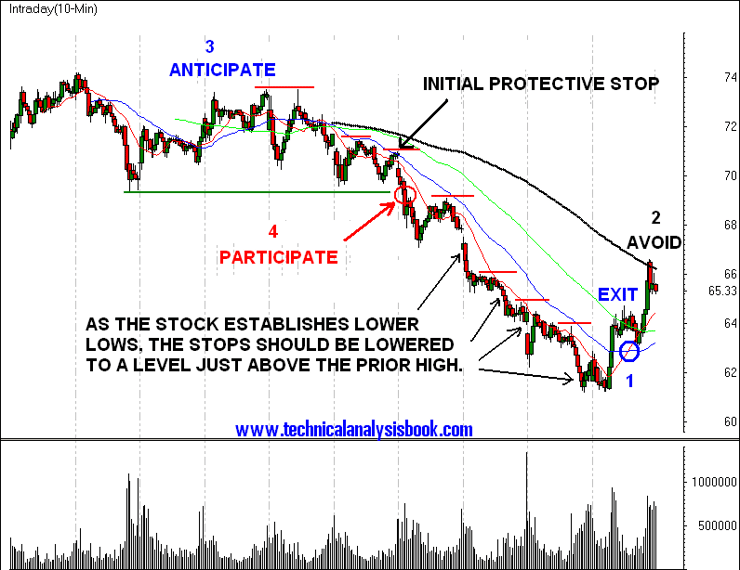
Students of my Pennystocking DVD know this concept to be the main point around which I base my trading. Shannon utilizes multiple timeframes in technical analysis using graphics like these, and then picking them apart, one variable at a time so the reader gets a total education in the differences between all the patterns.
What Are Timeframes?

Timeframes refer to the period that traders analyze when studying market trends. They range from 1-minute charts for day trading to monthly charts for long-term investment. Combining different timeframes for technical analysis can give you a broader perspective on market movements and improve trade entries and exits.
To fully grasp the intricacies of trading, it’s essential to familiarize yourself with the key trading terms. This comprehensive list of trading terms you need to know can be a valuable resource in your trading journey. It covers a wide range of terms, providing clear and concise definitions to help you navigate the world of trading.
Brian Shannon’s Squeeze Dynamics Theory
Brian Shannon’s Squeeze Dynamics Theory offers a comprehensive approach to understanding market trends. It involves integrating various timeframes into technical analysis to identify trading opportunities based on chart patterns and price movements.
Overview of Squeeze Dynamics Theory
Incorporating multiple timeframes in the analysis can help you identify cyclical patterns in the stock market, with periods of low volatility (the “squeeze”) followed by periods of high volatility (the “release”). It sees the market as a living, breathing entity, moving in rhythmic patterns. It’s about identifying these patterns and riding the wave to maximize returns and minimize risk.
The Four Stages of Squeeze Dynamics Theory
Squeeze Dynamics Theory has four stages: accumulation, markup, distribution, and markdown.
Comparing and contrasting different timeframes in technical analysis can offer clear indications of when to step in and when to step back.
Profit Potential with Squeeze Dynamics Theory
Squeeze Dynamics Theory has immense profit potential. It allows traders to identify opportunities where a stock’s price is likely to break out or bounce back. Analyzing price movements across multiple timeframes can lead to increased trading volume and substantial price movements, offering profitable trade setups.
Top Best Multiple Timeframe Strategies for Technical Analysis
Studying the relationship between different timeframes in technical analysis can optimize your trades and maximize profit.
The right tools can make a significant difference in your trading journey. A reliable trading platform can streamline your trading process, provide real-time data, and offer various features to enhance your trading experience. Whether you’re a day trader or a long-term investor, having a robust trading platform is crucial.
If you’re in search of a reliable platform, check out this guide on the best trading platform for day traders. It can help you make an informed decision and choose a platform that best suits your needs.
Breakout
The “Breakout” strategy leverages the power of momentum when a stock price moves above a certain level of resistance. Evaluating the signals and patterns across various timeframes can help you leverage the power of momentum and avoid false breakouts.
Bounce
On the other hand, the “Bounce” strategy comes into play when a stock’s price hits a level of support and then starts to rise. This is your signal to purchase the stock, anticipating a rise in its price.
Assessing the impact of multiple timeframes on technical analysis can help you accurately identify levels of support and resistance.
Highs & Lows
Interpreting the findings of technical analysis across multiple timeframes can guide you in trading in the direction of highs and lows.
In an upward trend, a stock’s price often makes higher highs and higher lows. Conversely, in a downward trend, the price tends to make lower highs and lower lows. Trading in the direction of these highs and lows can prove profitable.
Candlestick Patterns
The more familiar you are with candlestick patterns, the better you’ll be at predicting future price movements. Synthesizing information from different timeframes in technical analysis can provide early signals about potential reversals in the market.
Undertaking the Detailed Brian Shannon Course
Taking Brian Shannon’s course could be a game-changer for your trading. It’s a detailed journey into the world of technical analysis, from the basics to the nitty-gritty of his Squeeze Dynamics Theory. You’ll learn how to recognize the four stages of this theory and how to trade in each stage optimally.
Examining the trends and patterns across different timeframes can be a game-changer for your trading, especially when you delve into the details of Squeeze Dynamics Theory.
If you want to go the less technical route, I’ve built my Trading Challenge to pass on the things I had to learn for myself. It’s the kind of community that I wish I had when I was starting out.
We don’t accept everyone. If you’re up for the challenge — I want to hear from you.
Apply to the Trading Challenge here.
Download the Stock Market Graph Analysis PDF
Identifying key support and resistance levels across multiple timeframes can be invaluable, and it’s worth investing in quality resources like Brian Shannon’s book to master this skill.
If you’re serious about your trading, seventy-something bucks plus shipping, tax, and other fees is a pretty small amount to pay.
Get Brian Shannon’s “Technical Analysis Using Multiple Timeframes” here.

Leave a reply