
Technical analysis is a fundamental tool for anyone involved in stock market investing. It’s a method that analyzes market activity, primarily through the use of charts, to forecast future price movements. This guide is tailored to break down technical analysis in a way that’s comprehensive for beginners yet valuable for seasoned traders.
You should read this article because it offers a comprehensive breakdown of technical analysis in stock market investing, providing valuable insights for both beginners and seasoned traders.
I’ll answer the following questions:
- What is investment technical analysis?
- How does trading with technical analysis work?
- What does technical analysis tell you?
- What are the different types of technical analysis?
- How can technical analysis benefit your trading?
- What are the basics of chart analysis in technical analysis?
- How do you use technical analysis in your trading strategy?
- What are the limitations of technical analysis?
Let’s get to the content!
Table of Contents
- 1 What Is Investment Technical Analysis?
- 2 The Basics of Technical Analysis
- 3 Types of Technical Analysis
- 4 Benefits of Using Technical Analysis in Trading
- 5 How To Use Technical Analysis
- 6 Tips for Trading with Technical Analysis
- 6.1 Identifying the Trend
- 6.2 Drawing Support and Resistance Levels
- 6.3 Establishing Entry and Exit Points
- 6.4 Position Sizing and Risk Management
- 6.5 Technical Indicators Used in Technical Analysis
- 6.6 Moving Average Indicator (MA)
- 6.7 Moving Average Convergence Divergence (MACD)
- 6.8 Fibonacci Extensions
- 6.9 Fibonacci Retracements
- 7 Difference Between Technical Analysis and Fundamental Analysis
- 8 Limitations of Technical Analysis
- 9 Key Takeaways
- 10 Frequently Asked Questions
- 10.1 Is Technical Analysis Effective in Predicting Market Movements?
- 10.2 How Important Is Chart Reading in Technical Analysis?
- 10.3 Can Beginners Easily Learn and Apply Technical Analysis?
- 10.4 How Do Shares and Securities Fit into Technical Analysis?
- 10.5 Why Are Forecasting and Backtesting Important in Investment Strategies?
- 10.6 What Is the Role of Credit Cards and Business in Financial Management?
- 10.7 Can You Provide an Example of Using Periods and Addition in Technical Analysis?
What Is Investment Technical Analysis?
Investment technical analysis is a trading discipline employed to evaluate investments and identify trading opportunities by analyzing statistical trends gathered from trading activity, such as price movement and volume. Unlike fundamental analysis, which looks at a company’s financials and industry conditions, technical analysis focuses solely on the price movements of a stock.

How Does Trading with Technical Analysis Work?

Trading with technical analysis involves examining stock charts and identifying patterns and trends that can suggest future movements. It’s not just about predicting stock prices but understanding the market sentiment and traders’ psychology behind price changes. This approach requires a keen eye for detail and the ability to interpret complex chart patterns and indicators.
The Basics of Technical Analysis
The core of technical analysis lies in the belief that historical trading activity and price changes are indicators of future performance. This method uses various forms of chart analysis to predict future stock price movements.
What Does Technical Analysis Tell You?
Technical analysis helps traders understand the strength of market movements. By analyzing past market data, traders can identify potential trends, support and resistance levels, and forecast future price movements. It’s a technique that transforms raw data into actionable trading insights.
Types of Technical Analysis

Technical analysis comes in different forms, each providing unique insights into market behaviors and potential trends.
Price Patterns
Price patterns, like head and shoulders or double tops and bottoms, signal potential market reversals or continuations. Recognizing these patterns can help traders anticipate future market movements.
Technical Indicators
Technical indicators, like moving averages and Bollinger Bands, help traders to confirm trends and signal potential buy or sell opportunities. They provide a measure of market sentiment and can be used to identify entry and exit points.
Chart Patterns
Chart patterns, such as triangles and flags, represent the consolidation and breakout of stock prices. Identifying these patterns can give traders an edge in predicting future price movements.
Trading Range
The trading range refers to the difference between high and low prices over a given period. Understanding the range helps traders to identify volatility and potential breakout points.
Candlestick Charts
Candlestick charts are essential for day traders, offering detailed information about price movements. They are instrumental in identifying market trends and reversal signals.
Benefits of Using Technical Analysis in Trading

Technical analysis is a crucial component of successful trading strategies, offering multiple benefits in the fast-paced world of stock trading.
Greater Insight into Market Price Movements
Technical analysis provides traders with a deeper understanding of market price movements. By analyzing past price actions, traders can develop insights into future price trends.
More Accurate Predictions of Future Price Movements
While no method guarantees 100% accuracy, technical analysis allows for more informed and potentially more accurate predictions of future market behavior.
Increased Trading Opportunities
With technical analysis, traders can identify more trading opportunities. By understanding patterns and trends, traders can spot potential trades that they might otherwise miss.
Identifying Trends Quicker and Easier
Technical analysis helps in quickly and easily identifying market trends. This speed and ease of analysis are crucial in markets where conditions change rapidly.
How To Use Technical Analysis

Technical analysis is a powerful tool in an investor’s arsenal, allowing them to navigate the complexities of the stock market with more confidence. To use technical analysis effectively, one must first understand that it’s not just about predicting the direction of stock prices, but about analyzing patterns and trends to make educated decisions.
In my years of trading and teaching, I’ve emphasized the importance of using a combination of analysis tools like oscillators and candlestick formations. These tools provide insights into market sentiment and potential price movements. Investors should also consider factors like interest rates, ETFs, and bonds, as they can influence market movements.
But first things first — you need a good trading platform. I use StocksToTrade.


StocksToTrade is a powerful day and swing trading platform that integrates with most major brokers. I helped to design it, which means it has all the trading indicators, news sources, and stock screening capabilities that traders like me look for in a platform.
It has the trading indicators, dynamic charts, and stock screening capabilities that traders like me look for in a platform. It also has a selection of add-on alerts services, so you can stay ahead of the curve.
Grab your 14-day StocksToTrade trial today — it’s only $7!
Chart Analysis Basics
The foundation of technical analysis is chart analysis. Understanding how to read and interpret stock charts is crucial for successful trading.
Top-Down Technical Analysis
This approach involves analyzing the broader market or sector trends before focusing on individual stocks. It helps in understanding the bigger picture before making specific investment decisions.
Focus on Price
The primary focus of technical analysis is price movement. Analyzing how prices have moved in the past can provide valuable insights into future movements.
Supply, Demand, and Price Action
Technical analysis is fundamentally about understanding the balance between supply and demand. This balance is reflected in price action, which in turn forms the basis of most trading decisions.
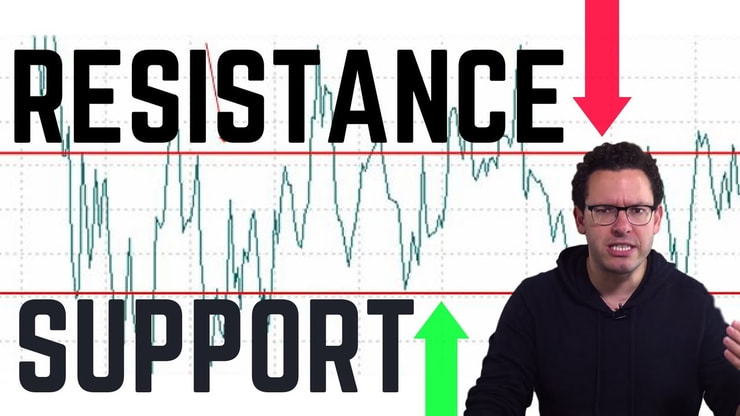
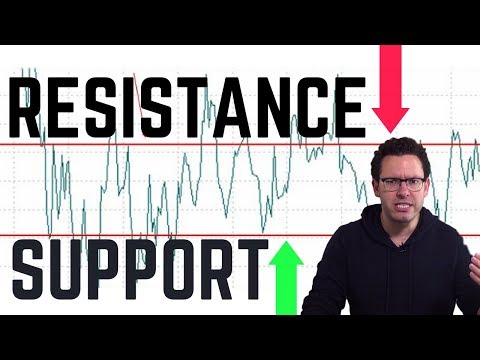
Support/Resistance
Identifying support and resistance levels is a key aspect of technical analysis. These levels can signify potential turning points in the market.
Pictorial Price History
Charts provide a pictorial history of a stock’s price and trading volume, offering a visual representation of a stock’s history and potential future.
Assist with Entry Point
Technical analysis can be instrumental in deciding the best entry point for a trade, helping to maximize potential profits and minimize risks.
Tips for Trading with Technical Analysis

Using technical analysis effectively requires certain strategies and considerations.
Identifying the Trend
One of the first steps in technical analysis is identifying the overall trend. Is the market in an uptrend, downtrend, or moving sideways?
Drawing Support and Resistance Levels
Identifying key support and resistance levels can help in making informed trading decisions. These levels often represent key psychological points for the market.
Establishing Entry and Exit Points
Technical analysis helps in establishing clear entry and exit points, a crucial aspect of successful trading.
Position Sizing and Risk Management
Effective position sizing and risk management are essential, ensuring that losses are kept within manageable limits.
Technical Indicators Used in Technical Analysis
Various technical indicators are used to interpret market data and inform trading decisions.
Moving Average Indicator (MA)
The Moving Average is a widely used indicator in technical analysis, helping traders to identify trends by smoothing out price movements.
Moving Average Convergence Divergence (MACD)
The MACD is a trend-following momentum indicator that shows the relationship between two moving averages of a security’s price.
Fibonacci Extensions
Fibonacci extensions are used to identify potential resistance levels and target prices.
Fibonacci Retracements
This tool is used to identify possible support or resistance levels, based on the Fibonacci numbers.
Difference Between Technical Analysis and Fundamental Analysis

The main difference between technical analysis and fundamental analysis lies in their focus and approach. While technical analysis is concerned with price movements and patterns, fundamental analysis delves into a company’s financials, industry conditions, and other macroeconomic factors. Technical analysts believe that all known information is reflected in the stock’s price, whereas fundamental analysts believe that stocks can be valued intrinsically based on their current/future earnings.
Limitations of Technical Analysis
Like any investment strategy, technical analysis has its limitations. One major limitation is that it’s based on the assumption that historical price movements will predict future price actions. However, market conditions can change rapidly, and unforeseen events can have significant impacts on the market. It’s important to use technical analysis as one part of a comprehensive trading strategy.
Key Takeaways

- Technical analysis is a vital tool for understanding and predicting stock market behavior.
- Various types of analysis offer different insights into market trends and potential movements.
- Effective use of technical analysis involves understanding chart patterns, indicators, and market sentiment.
- Technical analysis should be used in conjunction with other trading strategies for the best results.
Trading isn’t rocket science. It’s a skill you build and work on like any other. Trading has changed my life, and I think this way of life should be open to more people…
I’ve built my Trading Challenge to pass on the things I had to learn for myself. It’s the kind of community that I wish I had when I was starting out.
We don’t accept everyone. If you’re up for the challenge — I want to hear from you.
Apply to the Trading Challenge here.
Trading is a battlefield. The more knowledge you have, the better prepared you’ll be.
How do you use technical analysis in your trading strategy? Let me know in the comments — I love hearing from my readers!
Frequently Asked Questions
Is Technical Analysis Effective in Predicting Market Movements?
Technical analysis can be effective in predicting market movements, but it’s not foolproof. It’s a tool that, when used correctly, can provide valuable insights but should be used alongside other methods for the best results.
How Important Is Chart Reading in Technical Analysis?
Chart reading is fundamental in technical analysis. Understanding and interpreting charts is key to identifying trends, patterns, and potential trading opportunities.
Can Beginners Easily Learn and Apply Technical Analysis?
Yes, beginners can learn and apply technical analysis, but it takes time and practice. Starting with the basics and progressively learning more complex concepts is essential. It’s also beneficial to practice with demo accounts before trading with real money.
How Do Shares and Securities Fit into Technical Analysis?
In technical analysis for stock market investing, shares and securities are primary focuses. Analyzing their price movements and patterns helps investors make informed decisions. Technical analysts study historical data of these instruments to identify potential future trends.
Why Are Forecasting and Backtesting Important in Investment Strategies?
Forecasting involves predicting future market movements based on historical data, which is crucial in forming investment strategies. Backtesting, on the other hand, tests the viability of these strategies by applying them to past market data. Together, they provide a comprehensive approach to understanding and navigating risk/reward in the stock market.
What Is the Role of Credit Cards and Business in Financial Management?
Credit cards and business finances are integral parts of personal and corporate financial management. Understanding how credit card usage impacts personal finance and how business financial health influences market securities is essential for investors in the stock market.
Can You Provide an Example of Using Periods and Addition in Technical Analysis?
In technical analysis, ‘periods’ refer to specific time frames used to examine data, such as daily, weekly, or monthly charts. ‘Addition’ can refer to adding various technical indicators or data points to these charts to enhance analysis. For example, adding moving averages to a monthly stock chart to identify long-term trends.

Leave a reply