
Professional traders use momentum indicators to make informed market decisions. Some examples of momentum indicators are the relative strength index (RSI) and the average directional index (ADX). At its heart, a momentum indicator maps volatile price changes.
When someone says ‘volatile price change,’ my spidey senses start tingling.
I started trading over 20 years ago with the idea to focus on the most volatile stocks. Those huge price swings are where traders have the most opportunity.
Everyone thought I was crazy.
When I started trading, my parents gave me all my bar mitzvah money. They thought I’d lose it and learn my lesson … I definitely learned a lesson.
A little more than 20 years later I’m up $7.4 million in profits and I’ve helped more than 30 others pass the $1 million milestone.
There’s a path to success in this market.
And momentum indicators play a significant role …
Table of Contents
- 1 What Is a Momentum Indicator?
- 2 Types of Momentum Indicators
- 3 How to Trade with Momentum Indicators
- 4 How to Set Up a Momentum Indicator
- 5 Advantages of Trading with Momentum Indicators
- 6 Limitations of Momentum Indicators
- 7 Key Takeaways
- 8 Frequently Asked Questions
- 8.1 What Does a Momentum Indicator Tell You?
- 8.2 How Do You Trade Using a Momentum Indicator?
- 8.3 What Are the Disadvantages of Using Momentum Indicators?
- 8.4 What Are Some Examples of Momentum Indicators Used in Technical Analysis?
- 8.5 How Can I Use Momentum Indicators as Part of My Trading Strategy?
- 8.6 How Do I Interpret the Data from a Momentum Indicator?
- 8.7 What Are the Highs and Lows in Momentum Indicators?
- 8.8 Are Momentum Indicators Suitable for Beginners?
- 8.9 Can You Explain the Theory Behind the Breakout Strategy and Its Relation to Momentum Indicators?
- 8.10 How Does the Stochastic Momentum Index (SMI) Fit Into the Range of Momentum Indicators?
What Is a Momentum Indicator?

Momentum indicators are tools that help traders determine price momentum. They can point out key buy and sell signals within a trader’s strategy. Momentum indicators can help us determine where the price will go next and when.
There are a few different indicator categories. A momentum indicator evaluates the speed of price changes in the stock market. This is essential because price movements are what we live and breathe as traders.
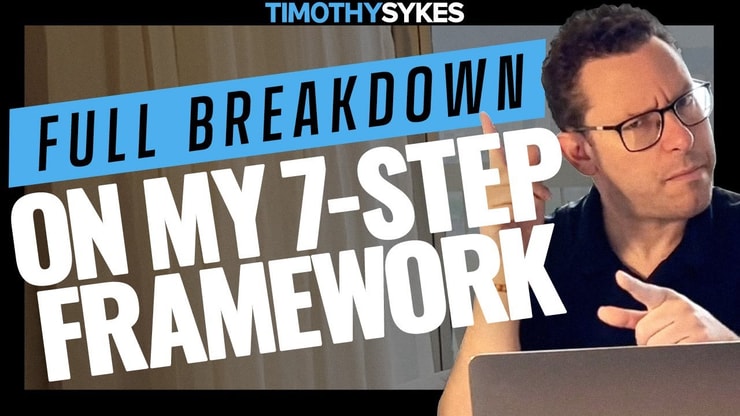
I’ve even managed to map key price patterns in the market. It’s called the seven-step framework and I’ve been trading it for years. See the video below …

Momentum indicators, when used correctly, can help identify when a stock’s price trend is gaining or losing steam, and this is critical. Why? Because trading is all about timing.
And momentum indicators, they’re your finely tuned wristwatch. Spotting uptrends, downtrends, and everything in between. It’s all about riding the momentum, folks.
Types of Momentum Indicators
Now, there are different flavors of momentum indicators.
You’ve got your RSI (Relative Strength Index), your ADX (Average Directional Index), your CCI (Commodity Channel Index), and the MACD (Moving Average Convergence Divergence).
These are the main tools in a trader’s toolkit. Each has its strengths and limitations, which we’ll dive into momentarily.
Right off the bat, I’ll let you know … I don’t use all of the indicators listed.
But my strategy is different from other traders in the market. You may find indicators helpful that I don’t care for.
Take the same journey as my millionaire students.
Join the Trading Challenge where I share my whole process and the only indicators I use.
- Trading indicators are a crucial part of any trading strategy, and understanding them can significantly improve your trading outcomes.
- One such indicator is the Average True Range (ATR), which measures market volatility. It’s a great tool for determining the stop-loss and take-profit levels in your trades. If you’re interested in learning more about this and other indicators, check out this comprehensive guide on average true range.
Any number of these can be used to measure the momentum of stock prices …
RSI (Relative Strength Index)

Ever heard of Welles Wilder? Well, thanks to him, we have the RSI.
It’s a tool that calculates the speed and change of price movements, ranging from 0 to 100.
If the RSI shows a reading over 70, it’s an indication a security may be overbought. Conversely, a reading below 30 may indicate it’s oversold. Use this tool to gauge the price strength of different assets.
But remember, no single tool gives the full picture. Trading results are better when we use a good group of indicators.
ADX (Average Directional Index)

Another key momentum indicator is the ADX.
Developed by Wilder (thanks again, man), the ADX helps traders identify the strength of a trend.
It doesn’t tell you the direction — just the strength. It’s like the arm-wrestler of indicators.
Alongside it, we have the Plus Directional Indicator (DI+) and the Minus Directional Indicator (DI-) to understand the direction of the trend.
CCI (Commodity Channel Index)
Next up, we have the CCI.
This isn’t just useful for commodities — it’s a versatile tool that measures the variation of a security’s price from its statistical mean.
High values show the price is above its average value, and low values indicate the opposite. It’s like the stock market’s own version of an ‘average Joe’.
MACD (Moving Average Convergence Divergence)
Lastly, we’ve got the MACD, which uses a combination of exponential moving averages (EMAs) to generate buy and sell signals.
When the MACD line crosses above the signal line, it’s a potential buy signal. Vice versa for a sell signal.
The MACD helps traders watch for divergences and convergences in moving averages. But like all indicators, don’t rely on it alone.
How to Trade with Momentum Indicators

When it comes to trading with momentum indicators, each one is suited for different strategies.
They can be used for scalping, day trading, or intraday trading, depending on your comfort level and risk tolerance.
Trading with momentum indicators requires a solid understanding of the market and the tools at your disposal. Here’s my advice: learn as much as you can.
One of these tools is the MACD indicator, a trend-following momentum indicator that shows the relationship between two moving averages of a security’s price.
It’s a reliable tool for identifying potential buy and sell signals. Learn more about how to use the MACD indicator in your trading strategy.
Best Momentum Indicator for Scalping
For scalping, where you’re making numerous trades within a short time frame, you need an indicator that responds quickly to price changes.
The ROC (Rate of Change) and SMI (Stochastic Momentum Index) can be your best friends here, giving you quick readings on rapid price movements.
Momentum Indicator for Day Trading
For day trading, the RSI and MACD are often preferred.
They provide information about overall trend strength and potential entry and exit points. Trend following is an important part of these indicators.
Remember, the goal here isn’t to invest — we’re trading based on patterns and trends, not long-term value. I’m not looking for an investment, I’m looking for a volatile spiker.
See the video below to see how I’m trading volatility right now …


There’s nothing wrong with investors, it’s just not my main strategy.
They try to make 10% on the year, I try to make 10% on the day.
Momentum Indicator for Intraday Trading
Intraday trading, where positions are opened and closed within a single trading day, requires a detailed view of the market.
Here, the ADX and CCI can be useful. They help gauge trend strength and asset price deviations from their average, respectively.
How to Read Momentum Indicators
Learning to read momentum indicators isn’t about memorizing some formulas.
It’s about understanding what each one tells you about price trends and market momentum. It’s the art of deciphering the language of the market.
And trust me, it’s a language worth learning.
How to Set Up a Momentum Indicator

Setting up a momentum indicator is as straightforward as opening an account or placing a trade.
Most trading platforms have them built in. You just need to know where to look and understand what each indicator tells you about the price action.
Setting up a momentum indicator is a crucial step in preparing for your trading day. However, understanding the different types of indicators and how they work can be a daunting task.
If you’re new to trading or want to expand your knowledge, this guide on day trading indicators is a great place to start. It covers everything you need to know about the different types of indicators and how to use them effectively.
Advantages of Trading with Momentum Indicators
The perks of trading with momentum indicators? They help gauge the acceleration of price movements, offer potential entry and exit points, and help identify potential market tops and bottoms.
They’re like your personal GPS in the financial markets.
Limitations of Momentum Indicators
But let’s be clear: momentum indicators aren’t the Holy Grail of trading.
They can give false signals, may lag behind actual price changes, and their effectiveness can vary based on volatility and other market factors.
Key Takeaways

Momentum indicators, they’re tools. Useful, yes.
They offer insight into price trends and momentum, but should always be used in combination with other tools and analysis. But only as good as the trader using them.
Trading isn’t rocket science. It’s a skill you build and work on like any other. Trading has changed my life, and I think this way of life should be open to more people…
I’ve built my Trading Challenge to pass on the things I had to learn for myself. It’s the kind of community that I wish I had when I was starting out.
We don’t accept everyone. If you’re up for the challenge — I want to hear from you.
Apply to the Trading Challenge here.
Trading is a battlefield. The more knowledge you have, the better prepared you’ll be.
What indicators do you already use? Did I mention one here? Let me know in the comments — I love hearing from my readers!
Frequently Asked Questions
Ready for a few quickfire answers to common questions about momentum indicators?
Let’s do it.
What Does a Momentum Indicator Tell You?
A momentum indicator tells you about the speed of price changes in the market.
It helps you spot changes in momentum, identify potential tops and bottoms on a chart, and can offer clues about potential entry and exit points.
How Do You Trade Using a Momentum Indicator?
Trading using a momentum indicator is about understanding what the indicator tells you about market momentum and price trends, and then making your moves accordingly.
The goal isn’t to predict the future. It’s about identifying patterns and trends that offer the best probability for profit.
The performance is better when a trader fully understands how it works.
What Are the Disadvantages of Using Momentum Indicators?
The downsides of using momentum indicators? They can give false signals.
They might lag behind actual price changes. And they aren’t infallible — the effectiveness of these tools can vary based on market volatility and other factors.
Remember, there are no shortcuts to success in the market. It’s all about putting in the work, understanding the tools at your disposal, and keeping that risk tight.
And remember to only trade with an amount you can afford to lose. Trading is risky. We don’t want to lose the rent money.
What Are Some Examples of Momentum Indicators Used in Technical Analysis?
Technical analysis involves a variety of momentum indicators to help identify the strength of a trend and potential reversals.
Some examples include the Moving Average Convergence Divergence (MACD), Rate of Change (ROC), Commodity Channel Index (CCI), Exponential Moving Average (EMA), and the Stochastic Momentum Index (SMI).
Each of these indicators uses a different formula and approach, but they all help to analyze the speed or velocity of price moves.
The MACD, for example, is a trend-following momentum indicator that shows the relationship between two moving averages of a security’s price, namely, the exponential moving average (EMA) and the Simple Moving Average (SMA).
How Can I Use Momentum Indicators as Part of My Trading Strategy?
Momentum indicators are a critical part of many trading strategies, particularly those based on technical analysis.
These tools can help you identify potential entry and exit points based on the strength of price moves.
For instance, you might look for a divergence between the price and the indicator (for example, the price hits a new high, but the momentum indicator does not) as a sign that the trend may be weakening.
Also, you could use the indicator to identify overbought or oversold conditions that may precede a price reversal.
It’s important to note that no indicator is foolproof, and they should be used in conjunction with other forms of analysis, including a thorough review of market events and trends.
How Do I Interpret the Data from a Momentum Indicator?
Interpreting data from a momentum indicator depends on the specific type of indicator you’re using.
For instance, with the MACD, you’re looking for the lines to cross as a potential signal. When the MACD line (which reflects the difference between two EMAs) crosses above the signal line, it’s considered a bullish signal, indicating it might be a good time to buy.
Conversely, when the MACD line crosses below the signal line, it’s a bearish signal, and it might be a good time to sell.
Volume can also play a role in momentum; increasing volume with a price move can signal strong momentum, while decreasing volume might suggest the move is running out of steam.
What Are the Highs and Lows in Momentum Indicators?
In the context of momentum indicators, “highs” and “lows” refer to the peak and trough levels that the price of an asset reaches within a specific timeframe.
These levels are often associated with resistance (highs) and support (lows) levels. A resistance level is a price point at which selling is thought to be strong enough to prevent the price from rising further.
The logic dictates that as the price advances towards resistance, sellers become more inclined to sell and buyers become less inclined to buy.
Conversely, a support level is where buying is strong enough to prevent the price from declining further. As the price declines towards support and gets cheaper, buyers become more inclined to buy and sellers become less inclined to sell.
Are Momentum Indicators Suitable for Beginners?
Momentum indicators can be a useful tool for traders of all experience levels, including beginners.
However, like all aspects of trading and technical analysis, they require study and practice to use effectively.
Novice traders should take the time to learn how different indicators work and understand the concepts behind them before incorporating these tools into their trading strategies.
It can also be helpful to use demo accounts to practice trading with these indicators before risking real money. There are numerous resources and courses available in English (and other languages) that provide comprehensive introductions to these topics.
Can You Explain the Theory Behind the Breakout Strategy and Its Relation to Momentum Indicators?
A breakout strategy involves entering a long position after the asset price breaks above resistance or a short position when it breaks below support.
The theory is that significant price movements above or below certain levels (support or resistance) can lead to significant price momentum in the same direction.
Momentum indicators like the MACD or ROC can help validate these breakouts by showing whether the price momentum supports the breakout.
How Does the Stochastic Momentum Index (SMI) Fit Into the Range of Momentum Indicators?
The Stochastic Momentum Index (SMI) fits into the range of momentum indicators by providing a refined view of price momentum.
It compares the closing price to the midpoint of the range, rather than to the high-low range used by many other oscillators.
This refinement makes SMI a valuable tool for identifying trend directions and their strength, giving traders potentially more accurate signals for their trading strategies.

Leave a reply