The moving average is one of the most popular stock indicators out there. Traders like it because it’s versatile. And it can show you important things about the market.
It can help you to clearly see support and resistance levels. It can also be good for seeing how a stock is trending.

I like this indicator. But like most technical indicators, I don’t rely on it alone. It’s one piece of the puzzle you need to figure out every time you make a trade.
Learning about technical indicators, like the moving average, is one way you can build your knowledge base. So let’s get into it.
Table of Contents
- 1 What Is Moving Average (MA)?
- 2 Is Moving Average a Good Indicator?
- 3 The Types of Moving Averages with Examples
- 4 Simple vs. Exponential: Which Moving Average Is Best?
- 5 How Do You Calculate a Moving Average?
- 6 How You Can Use Moving Average to Trade Stocks: 3 Top Crossover Strategies
- 7 The Bottom Line on Moving Average
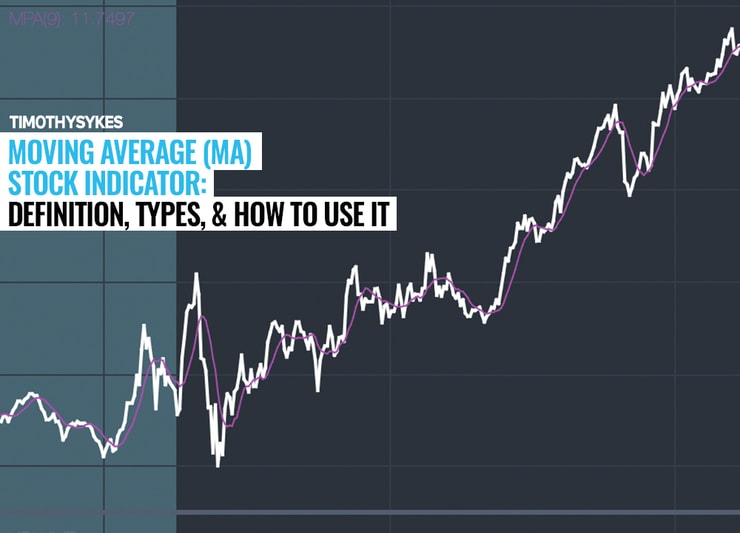
What Is Moving Average (MA)?
Moving average has a simple meaning … It’s a way to chart daily price points over a period of time.
It uses a stock’s daily closing price as a data point. This is averaged out over a set period.
These time periods used to be somewhat standardized. But modern charting software makes it easy. Now you can fill in any variables you want.
As new price points are plotted on a stock’s chart, the last number in the moving average changes. This will move the trendline.
Short-term moving averages will stick closer to the latest price than long-term ones. But long-term traders trust in the value shown by longer-term moving averages.
Is Moving Average a Good Indicator?

The moving average is a foundational stock indicator. It has widespread use among more technical traders.
And it’s influential, too. Bollinger Bands®, the MACD, and the McClellan Oscillator all use it.
I like moving averages for a few reasons. First off, they’re really good at doing the thing they’re designed for. They chart price action cleanly without noise and choppiness. This can be helpful when you’re dealing with high volatility stocks like the ones I trade.
(If you don’t know why volatility is a good thing, I built my no-cost ”Volatility Survival Guide” for traders like you.)
The smooth line you get with moving averages can also be helpful. It can show a stock’s support and resistance levels over a longer timeframe. That’s valuable for your trading plan.
It can help you — if you use it right. In my mind, that’s enough for the moving average to qualify as a ‘good’ stock indicator. The bad side comes out of misuse.
Many traders use moving averages to identify price trends. And they’re actually great for that. If the price crosses the moving average line on its way up, the stock is in an uptrend. If it crosses as it goes down? You guessed it … downtrend.
The problem here is that some people look at these trends as an indicator of future movement. In reality, the moving average is a trend-following indicator. The price moves first, and the moving average moves second.
If you’re depending too much on moving average, you’ll always be behind.
The Types of Moving Averages with Examples
Here’s the part you can spend your life on — which formula works for you?
Some stock geeks have spent their careers fine-tuning the moving average. But traders use three basic ones the most:
- Simple moving average (SMA)
- Exponential moving average (EMA)
- Weighted moving average (WMA)
The differences among these three lie in the importance given to the most recent data points…
Simple moving averages treat all data points as equal. Exponential moving averages give increasingly more importance to recent data points. Weighted moving averages also put greater focus on recent data but in a more even way.
Some people call moving averages ‘rolling averages’ or ‘trailing averages.’ Let’s keep it simple and use moving average.
Simple Moving Average (SMA) + Example

A simple moving average takes an average of the data points specified.
For example, a nine-day SMA takes the average of the last nine days of a stock’s price. It changes each day — it ‘moves.’ It gives you a picture of a stock’s recent price action, along with some perspective on its trading value.
But this isn’t the way people use moving averages on modern charting software. These days, a moving average samples periods instead of days.
If you’re looking at a one-year chart with daily candles, your nine-period SMA could be a nine-day SMA.

But if you’re looking at a one-day chart with one-minute candles, your nine-period SMA will be a nine-minute SMA. See how much closer it sticks to price action?

Make sense? I know, it’s a bit of math.
Exponential Moving Average (EMA) + Example
An exponential moving average gives your moving average more of a recency bias. This is good in some cases — after all, you’re looking to trade now, not nine days ago. But it carries the danger of giving off false signals.
EMAs use a multiplier to prioritize more recent periods. This is one of the interventions used to make it lag a little less.
Look at the one-month chart below to see how it reflects extreme price moves a bit more faithfully.

Simple vs. Exponential: Which Moving Average Is Best?
Forgive the pun … but this isn’t a simple question.
Like I said before, there are a few reasons you might want to use a moving average in the first place.
Determining price trend is more of a proactive reason. Moving averages smooth out a stock’s highs and lows. This can give you a more accurate depiction of a stock’s trending direction.
If you use a simple moving average here, you risk missing out on a stock that pops. But an exponential moving average could mislead you about the stock’s longer-term direction.

Long-term directions matter less to day traders like me than to longer-term traders. But a stock’s history still matters.
If a stock hits a 52-week high, that could be a sign of a breakout. But if it’s regaining levels it last hit a year and a half ago, that might mean a big sell-off is in its immediate future.
You can also use this indicator for support and resistance.
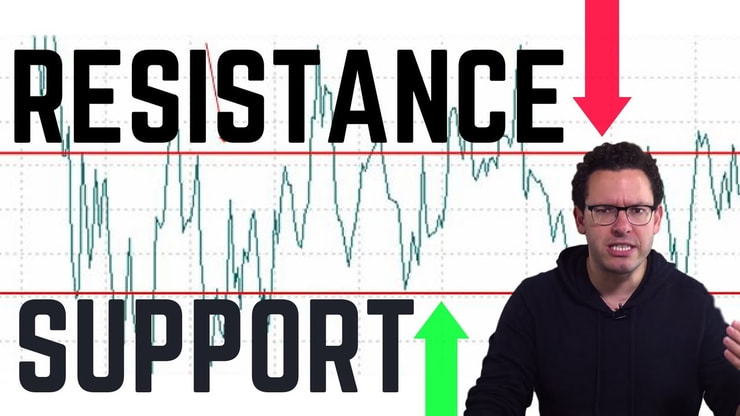
Simple moving averages will show a better picture of historical support and resistance.
That’s great for certain stocks, less so for others. If you’re trading a volatile stock, you might want to use exponential moving averages instead. Since they’re more reactive to highs and lows, they might give you a better impression of what the market is doing.
How Do You Calculate a Moving Average?

Before modern trading software, it was much harder to calculate moving averages. They didn’t publish to-the-minute stock prices in the daily newspaper.
Now traders can use moving averages more easily. Just make sure you have a trading platform that’s up to the task.
The one I use is StocksToTrade. StocksToTrade has all the things that I found missing in other trading platforms. That’s because I helped design it, with a trader’s needs in mind. (Full disclosure: I’m also an investor in it.)
For me, StocksToTrade makes it easy to deploy moving averages on a stock chart. You can play with the intervals. The product is clean, so you can see what your chart is telling you.
Here’s what else I like about StocksToTrade:
- The platform comes loaded with a variety of built-in and easy-to-customize stock screeners. This lets you plug in exactly what you’re looking for in potential trades.
- Its news scanner picks up on press releases, tweets, SEC Commission filings, news articles, and more. And the Breaking News Chat gives you the news that matters.
- I think its charting is easy, intuitive, and looks good.
Try it here —get a 14-day trial for only $7. Or get it with the game-changing Breaking News Chat add-on for $17.
Moving Average Formula
You’re the type who likes to do your own work? I can appreciate that.
Here’s a 10-day simple moving average. Add all the days together, and then divide the total by the number of days.
It looks like this: (Day 1 + Day 2 + … Day 9 + Day 10) ÷ 10 = SMA.
An exponential moving average is A LOT more complicated. Here’s the basic idea…
(Today’s price) × [2 ÷ (Number of days) + 1] + (Yesterday’s EMA) × {1 − [2 ÷ (Number of days) + 1]} = Today’s EMA
OK, now let’s never do that again.
How You Can Use Moving Average to Trade Stocks: 3 Top Crossover Strategies

You know how I always tell you to keep it simple? Well, let’s get a little deeper here.
Moving averages matter for the same reason any indicator worth its salt does. People believe in them.
Here’s a hypothetical setup: A stock’s nine-day EMA makes a strong upward move across the 20-day EMA. Many traders believe this signals a future breakout.
Why do I care about this pattern? It does say a lot about a stock’s recent performance. But mostly I care because other traders care.
The market is a game of cat-and-mouse played by people who all think they’re the cat. Most traders think they’re going to catch the mouse and get a nice dinner.
I want you to be the mouse. We all know how those old cartoons played out. Let the cat chase after things while you tie its tail to the dog.
I’m not outlining these indicators because I want you to base your trades on them. I want you to react to what the market thinks of them.
If you want to beat the cat at its own game, but learn how to think like it first.
Crossovers Are a Trading Signal
This is the most popular moving average strategy.
There are a lot of traders using this setup. Particularly on longer-term charts. A short-term moving average crossing a longer-term one can be a sign of momentum.
If the short-term moving average crosses upwards, a lot of traders see it as a bullish signal. When it makes a clear cross downward, it’s seen as bearish. When the lines bounce off each other, it signals a continuation of the trend.
Here’s a look at FCEL’s one-month chart. If you’re a swing trader, trading crossovers here could have helped you.

Be Careful Day Trading Crossovers
This is the part where I tell you to be cautious. No indicator can guarantee future price movement.
When you’re day trading volatile stocks, crossovers can be misleading. Let me show you a typical day of confusing signals.

If you traded on these crossovers, you might have done all right … but you’d have been a step behind the market.
The Market Believes in Them
There’s a lot you can do with moving averages. And there are a lot of traders using them for different reasons.
Some use crossovers as a trading signal. Some use longer-term moving averages to determine support and resistance levels.
Because so many traders use this indicator, it can tell you something about a stock’s future. You just need to understand that it tells you more about traders than about the stock itself.
The Bottom Line on Moving Average

The moving average stock indicator is one tool you can use in your pursuit of trading consistency. And I want you to learn it by heart.
Surgeons don’t focus on the tools they use. The tools just help them achieve their real goals. That’s what you need to do.
This is one step on the way to becoming a consistent trader. If you want to commit to this path, apply to my Trading Challenge.

I don’t accept just anybody. But if you want to succeed badly enough to put in the work, apply. You’ll get 6,000 video lessons, live trading webinars, and an awesome community of traders … if you’re ready to work and are accepted.
So keep grinding in your knowledge pursuit. I want you to forget more than other traders know.
How do you feel about moving averages? Do you use them in your trades? Let me know in the comments — I love hearing from readers!

Leave a reply