As a trader, it can sometimes seem like you’re voyaging into uncharted waters without a map or a compass. Will this stock sink or swim? Will you make money, or will you lose big?
There are plenty of storms you can encounter when trading, so it’s important to do all you can to stay protected and safe.
One of the easiest ways to become safer and more secure in every trade is to make a trading plan.
Your trading plan is like your personal map for a trade. It’s almost like you’re manufacturing your own personal north star for guidance.
When you make a clearly thought out trading plan, you add an essential piece to your trading toolkit. It can make the difference between a good and great trader.
In this post, I’ll guide you through the art of crafting an effective trading plan. You’ll learn about why it’s such an essential tool, and how to create a great trading plan in five easy steps.
Table of Contents
What is a Trading Plan?

A trading plan is pretty much just what it sounds like. It’s a written plan where you map out your plan of action for a given trade.
In your plan, you make your intentions clear in terms of why you’ve decided to make the trade, why it’s a good idea, and what you hope to gain.
You also detail the specifics of the trade, including your entry and exit points and stop loss (whether mental or real).
The actual format of your trading plan is up to you. It might be an Excel tab, it might be listed in a word document, or it could just be a handwritten note.
The one thing I don’t suggest is keeping the trading plan all in your head. You’re far more likely to stick with it and stay accountable if it’s a physical document.
The Goal of a Trading Plan

Ultimately, the goal of a trading plan is to improve your chances of profiting from a given trade. This is a good thing, so why do so many traders skip making plans?
Because trading plans are not sexy. Many traders ignore them in favor of more exciting aspects of trading, like chasing hot stocks and chart spikes, and looking at news and catalysts.
However, this is a big mistake. While those things are all part of the process, without a trading plan, you aren’t preparing yourself to use all the information you’ve collected to your advantage.
Basically, a trading plan offers you the chance to take those sexy parts of trading and apply them intelligently.
While a trading plan is not technically required before you execute that market order, it is something that many experienced traders swear by and credit with an improved track record. Here are some of the specific ways a stock trading plan can boost your trading:
- Tailor trades to your specific trading style. The trading plan helps you take into account things like your personal level of risk tolerance, trading style, and expectations. So in that way, it helps you tailor the trade to suit your style and preferences.
- Makes you consider potential outcomes. It’s incredible how many traders will take positions without ever considering what might happen in the trade. By making a trading plan, you’re forced to consider both best and worst case scenarios, which can help you remain more tactical.
- Clear plan of attack. A trading plan allows you to have a clear-cut plan of attack for entering and exiting a trade. It makes all the difference between a calculated trade and the “hold and hope” mentality that causes so many traders to lose money.
- Increased accountability. A trading plan also helps keep you accountable. When you create a trading plan, you have a roadmap to follow within your trade. If you follow it, you’ll be far less likely to lose your head and make emotional decisions that can potentially lead to mistakes and losses.
Without a trading plan, you’re gambling more than trading. Sure, you might have some wins, but there won’t be a rhyme and reason to what is working.
If you don’t use trading plans, chances are that your losses will begin to exceed your gains. This can be extremely discouraging and is one of the top reasons why traders give up.
Don’t become one of those cautionary tales. Be sure to take the time to make a trading plan, every time!
Developing a Trading Plan in 5 Steps

Now that you’re sold on why you need a trading plan, let’s talk about how to make it happen. Here’s how to make a trading plan in five steps:
#1 Create a Watchlist
Before you can develop a trading plan, you have to set your sights on the potential trade. So how do you narrow down stocks to trade from the thousands of potential plays out there? By creating a watchlist.
A watchlist is a short list of potential stocks that you’re considering trading. The number of stocks on your watch list might range from just a few to hundreds, though I suggest that you keep it small, especially if you’re just getting started.
If you’ve ever “watched” something on eBay, it’s kind of similar. You keep track of the companies and stocks on your watchlist so that you can be ready to pounce on opportunities when the price is right.
It boils down to waiting for the stocks to meet certain criteria. Often, you’ll be looking at volume, breakouts or breakdowns, or deviations from a moving average.
If you’re part of my Trading Challenge, then you already know that I send out watchlists on the regular. While this can be a great starting point, I urge my students to learn how to make their own watchlists, too.
How do you do that? Well, everyone will go about making a watchlist a little differently, but if you want to model yourself successfully, consider how one of my most successful students, Tim Grittani, does it.**
Tim starts by narrowing down the thousands of stocks available to only the ones that are up 10 percent or more for the day with 3 million shares or more trading volume. Depending on the day and the market climate, this might be just a few stocks, or it might be 20 or so.
From that starting point, he goes through every stock on that list and looks at the charts in more detail. Are there any evident patterns, or is there some sort of a catalyst that looks promising?
Typically, this will further narrow down the list and can help you make the choice about whether to take a long or a short position on a trade.
Once you’ve narrowed down your watchlist, you will at this point have a few strong contenders for a trade, and it’s a matter of watchful waiting.
While it’s not easy to monitor hundreds of stocks at once, it’s accessible to keep track of five or so. You can screen and review these stocks on your list frequently.
You might create a spreadsheet and develop a loose trading plan for the most promising potential trades. This will help you to be prepared when an opportune moment presents itself.
Consider these things before allowing a stock a coveted spot on your watchlist:
- Does it stick to a pattern I’ve had success with?
- Is there sufficient volatility/potential for profit?
- Which direction is the stock going pre-market? Up or down?
For more tips on how to create a watchlist, be sure to watch this video.
#2 Check Stock Indicators
Stock indicators are one of the key ways to narrow down your choices for a potential trade.
An indicator is a statistic you can use to assess the current market and the space that certain stocks occupy within it. It helps you narrow down your stock choices and gives you context as to where the market is right now.
There are two key types of indicators: economic and technical.
- Economic indicators are what you’ll use to identify what’s going on in the greater economy or within a sector. This can help you identify companies or sectors that are hot right now and where you might have the most potential for profit.
- Technical indicators help you look at what’s going on with a specific stock. They can help you begin to see trends in the price, which can help key you in on potential price increases or decreases.
By checking stock indicators, you can start asking yourself the questions that will help you diminish risk, such as:
- What’s a good entry point for this trade?
- If this trade doesn’t go how I’d like, when will I cut my losses?
Stock indicators can help you approach trades from a steadier, stronger foundation for executing trades.
You’ll never be able to control every factor in trading, and you can’t predict every outcome. But by checking these indicators, you can begin to identify how to control your losses.
It’s an important shift that every trader should experience: that of going from chasing stocks to hunting them in a calculated, thought-out way. This takes you ahead of the curve rather than simply following it.
#3 Stock Chart Analysis
Stock indicators can help you filter down potential stocks to trade. But once you’ve narrowed it down, you need to get down to brass tacks by performing detailed stock chart analysis.
There are two types of stock analysis: fundamental and technical.
While I’m more focused on chart-based technical analysis, it’s important to know about fundamental analysis, so let’s just briefly go over that.
Fundamental analysis is the research you perform to find out more about the business offering the stock in question. If you’ve ever Facebook-stalked someone, it’s like you’re doing that, but with companies instead of individuals.
With fundamental analysis, you’ll read through the company’s news and review their earnings reports to gain insight as to who they are and what makes them tick. You’re looking for dirt like debt, news, potential catalysts — basically anything that could affect the value of the stock you’re considering.
You do need to know a few business finance basics to get the most from fundamental analysis, so consider reading this post on earnings reports to help you see what kind of information can be helpful in your fundamental analysis.
Don’t get me wrong: Fundamental analysis is important. However, you should never make any final decisions about a trade based on fundamental analysis alone. You need to back it up with stock chart analysis, or technical analysis.
With technical analysis, you’re using a trading platform like StocksToTrade to look at a stock’s specific price action over time. Why look at what has already happened? Because looking at the past can help you try to predict the future.
I refer to myself as a glorified history teacher. I find that if you look at a stock’s chart over time and see patterns emerging over and over, then chances are it will repeat what it has done in the past.
To be clear, if a stock experiences a single spike, it could be an anomaly based on news or another catalyst. But if you see a similar spike occurring at a certain time of day or a certain time of year over and over, this could be a sign that it will do it again.
This number- and data-based approach can help you focus on the numbers and help you from becoming too emotional in trades.
A good trading platform will supply you with a number of different criteria for your charts. My favorite technical analysis tools are the simple moving average, moving average convergence/divergence, relative strength index, and the parabolic SAR.
And yes, I do rely on my own past experience. I’ve been in the market for years, and when I see what seems like a good thing based on the numbers, I feel better about considering my gut instinct. The key is not believing the hype!
#4 Choose Clear and Easy Patterns
Don’t just look for any patterns in potential stock plays — look for clean and easy ones.
There’s no need to make trading harder than it needs to be. If you’re looking at a chart and scratching your head over whether there’s a pattern or not, then it’s time to let it go. You’re looking for clear, identifiable patterns here.
After all, patterns should be exactly what they sound like: predictable and reliable and repeating. Patterns like these are eerily similar and can potentially help you plan future trades.
Here are some clear and easy patterns to look at:
Morning Panics
Panic selling happens when a stock experiences a big decline based on volume. This can happen due to any number of reasons, but a common one might be breaking news related to the company. Based on the price decline, both buyers and sellers are catapulted into action.
A morning panic is just what it sounds like: a panic selling event that happens right when the market opens. There’s a flurry of activity as traders get scared and get out of their positions.
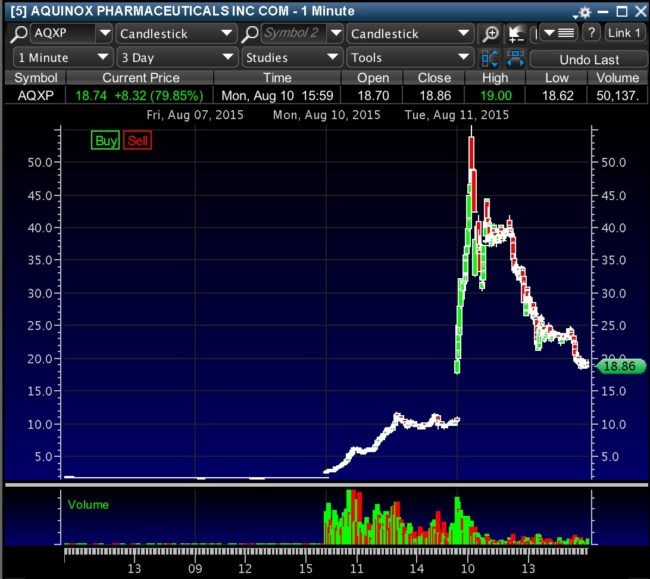
The thing is, with a morning panic, there’s often a reliable trajectory. For instance, the stock price might dip, then experiences an uptrend based on activity, then continues the negative trend.
How can you differentiate between a stock making a big and permanent move and a predictable morning panic? It’s all in looking at the patterns. In this video, I detail an example of the type of morning panic I love.
Breakouts
Breakouts are another great pattern to look for. It’s a way of being able to take advantage of an emerging trend.
A breakout occurs when a stock’s price moves out of specific support and resistance levels, and with increased volume.
Once a stock breaks these barriers, the volatility has a tendency to increase, and the price will go either up or down depending on the direction it’s going (up or down).
To take advantage of a breakout, you’d either take a long position following the stock price breaking resistance, or a short position following the stock dipping below support.
You’re trying to take advantage of the fairly predictable tendency for volatility to increase, which can create swings in price that can potentially net you profits.
#5 Cut Losses Quickly
When I enter a trade, one of my #1 trading rules isn’t focused on making money. Instead, it’s centered on how to avoid losing money.
Cutting your losses quickly is key if you want to stay in the trading game long term. As such, pre-determining where you’ll cut losses is a hugely important part of creating a trading plan.
Before you make a trade, you need to decide when you’ll enter a position. This means that by using the indicators and charts detailed in prior steps, you’ll decide what buy signals will give you the green light for getting into a trade.
But you also need to think about your exit strategy.
To do this, you need to consider the best- and the worst-case scenario. Even if things are going well, decide before you make the trade when you’ll exit: what your desired happy place is with profits. Don’t get greedy, because you could potentially lose big by holding on too long.
And of course, you need to consider the worst-case scenario too. If the trade starts going south, what is the point at which you’ll cry uncle and get out of your position?
It can be really hard to do this in the heat of the moment, so decide BEFORE you get into a position where you’ll make that exit.
Resolve to get out if the price action reaches this point, and without regret. Here are some examples of when you might need to cut losses quickly:
When a Breakout Doesn’t Continue
Not every breakout can be predicted, and not every breakout will follow your desired pattern.
If the breakout doesn’t continue, it’s time to cut your losses. If a stock isn’t following the pattern, then you’re basically gambling — it’s time to get out!
When a Breakdown Doesn’t Continue
A breakdown is the word used to describe when a stock goes through resistance to decrease in price. Once again, if it doesn’t follow the pattern you’ve identified, it’s time to get out of the trade. There’s absolutely no shame in cutting losses.
Key Tips to Succeed With Your Trading Plan
Now that you’ve got the building blocks for how to create a trading plan, here are some tips to make the most of them:
Strategy: Stick to Your Trading Plan
Even the most beautiful and meticulous trading plans won’t do much if you don’t stick to them. So how do you stick to it?
First, make a mental resolution to follow it. Making a mental commitment is the first step to actually making it a reality!
Second, write down your plan. I mean this literally. When you have it physically in front of you, whether it’s a printout, on your screen, or taped to your monitor, you’re far more likely to stick with it.
When your trading plan is staring you down, you’re more likely to pay attention and stay true to it.
Mindset: Be Mentally Prepared
You’ve got to be in the right headspace for trading to make the most of your trading plan.
Before you enter a trade, consider how you’re feeling emotionally. Did you get enough sleep? Are you hungry? Are you feeling stressed? If so, you might not be mentally prepared to trade, no matter how well crafted your trading plan.
For the greatest trading success, make sure that you’re psychologically ready for it. Trading psychology is super important, because no matter what, as long as you’re human, there will always be an emotional aspect to trading.
Preparation: Take Part in My Trading Challenge
File under “duh”: You’ll be able to create the best thought out trading plans if you actually have an idea of how trading works.
Education is one of the best ways to assure preparedness in trading. I established my Trading Challenge so that my students wouldn’t feel rudderless on the choppy waters of trading.
I want my students to learn how to be long-term traders. To do this, I focus on actually helping them learn how to identify and execute trades themselves.
The curriculum introduces you to a variety of different trading styles and methods, and how to take advantage of the ever-fluctuating market.
My watchlists, daily alerts, and webinars help you learn what you need to know about the market so that you can create the most thoughtful and relevant trading plans. If you want to strengthen your trading through education, consider joining my Challenge.
The Bottom Line
Trading plans can be a real game-changer for your trading. They can take you from a mentality where you’re chasing the brightest and shiniest stocks to the mindset of a calculated hunter where you’re slowly circling around potential profits.
When you consistently create and stick to trading plans, you’ll be better able to monitor what setups are the most consistent and potentially profitable for you. This can help you further refine your trading and potentially improve your success rate over time.
Creating a trading plan can help you improve as a trader and increase your understanding of the market. While it takes time and effort, it’s well worth it to make a trading plan every time.
Do you make trading plans? What do you ALWAYS include in them? I want your comments.

Leave a reply