
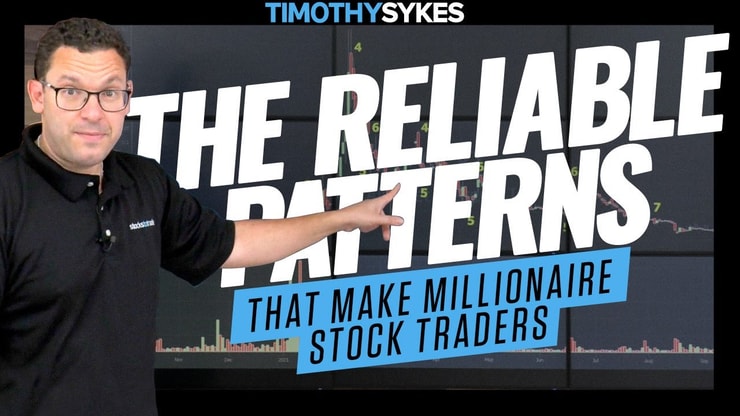
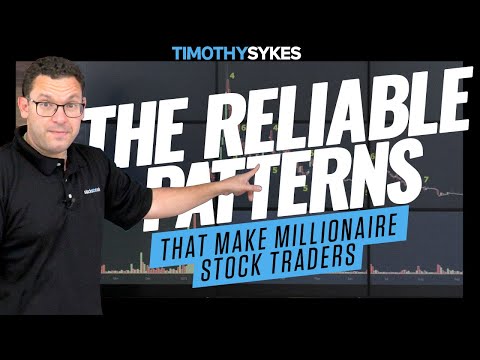
Price action trading is the act of analyzing price charts to determine possible trade opportunities. It’s a strategy where traders look at the chart to determine a possible next move.
Price action is maybe the most useful tool we have in trading.
But most new traders get it wrong for one or both reasons …
- They don’t focus on the best stocks
- They don’t know the best patterns
That’s where I come in.
I’ve managed to stay profitable in this niche for over two decades. I know how to find the best stocks to trade. And I know which patterns to use.
I’ve also helped over 30 of my students pass the $1 million milestone. We use price action trading all the time.
Here’s how …
Table of Contents
- 1 What Is Price Action Trading?
- 2 How to Read and Use Price Action
- 3 Price Action Trading Strategies
- 4 Price Action vs. Indicators
- 5 Pros and Cons of Price Action Trading
- 6 Price Action in Different Time Frames
- 7 Practical Examples of Price Action Trading
- 8 Key Takeaways
- 9 FAQs on Price Action Trading
- 9.1 How Profitable is Price Action?
- 9.2 Who Are the Most Successful Price Action Traders?
- 9.3 Can Beginners Successfully Use Price Action?
- 9.4 How Do Price Action Patterns and Signals Help in Price Action Analysis?
- 9.5 How Does Momentum and Other Market Dynamics Like Supply and Demand Influence Price Action?
- 9.6 What Are Some Effective Trading Strategies for Price Action?
- 9.7 What Resources Are Available for Learning More About Price Action Trading?
- 9.8 What Is the Role of Losses and Spreads in Price Action Trading?
- 9.9 How Does Understanding a Price Action Chart and Its Elements Like Candlesticks and Bars Influence a Trader’s Position in the Commodity Market?
- 9.10 What Research and Learning Resources Can I Access To Understand the Field of Price Action Trading?
- 9.11 How Do Organizational and Personal Factors, Like One’s Publishing Family or Career, Influence Their Approach To Price Action Trading?
- 9.12 How Do Different Trading Actions and Tools Like Buying Positions, Options, and Using a Lot Size, Contribute to the Results of Price Action Trading?
- 9.13 How Can the Understanding of Candlesticks Help Me Interpret the Seller’s Position in a Given Market Scenario?
- 9.14 How Does the Case or Trend of the Price Action Chart Inform My Trading Decisions?
- 9.15 What Type of Results Can I Expect From Utilizing a Price Action Trading Strategy?
- 9.16 What Role Does Accuracy Play in Interpreting Price Action Charts?
- 9.17 How Do Personal Attributes Like Chance Taking, Sense of the Market, and Business Acumen Influence a Trader’s Results in Price Action Trading?
What Is Price Action Trading?

Price action trading is a trading technique that allows a trader to read the market and make subjective trading decisions based on recent and actual price movements, rather than relying solely on technical indicators.
Because it ignores the fundamental analysis factors and focuses more on recent and past price movement, price action trading is applicable to nearly all financial markets. Whether you’re trading stocks, forex, or commodities, price action matters.
The Definition of Price Action Trading

Price action trading, in a nutshell, is the art and science of interpreting price movements in the market without the crutch of indicators.
It’s about understanding the market structure, trend direction, and potential breakout points, using nothing but the raw price data on a chart.
Understanding Candlestick Charts
Candlestick charts are the bread and butter of price action traders. There are a few types of charts but candlesticks show us the most data and are still easy to digest.
It’s crucial to understand these concepts …
Each candlestick represents a specific time frame and displays the open, high, low, and closing prices of a security for that period. The chart gets its name because of the candlestick shape.
These charts provide traders with a wealth of information about what is happening in the markets, enabling them to make informed trading decisions.
And I’ve got chart examples in the video below …
It’s about reading the pulse of the market, right from the heart of price action.
How to Read and Use Price Action
Once you’ve got a firm grasp on what price action trading is and how candlestick charts work, it’s time to delve into the heart of price action trading: reading and using the price action itself.
Let’s move past the introduction …
First, it’s essential to understand that free chart software usually displays price data with a latency of 10 – 20 minutes.
Late data is dangerous for day traders.
We thrive on highly volatile movements. If we want to sell at a price peak, it’s difficult to tell when and where that is because the actual price is ten minutes ahead of us.
That’s why I use StocksToTrade. It is designed for day traders and the price data is always up to date.
Try a 14-day trial of StocksToTrade for just $7.
And remember, this isn’t about following signals blindly — it’s about understanding the market’s language and making your own decisions.
How Do I Read Price Action?

To read price action, you need to scrutinize candlestick charts and identify patterns.
I hope I have your attention, my next words are important …
Look for signs of resistance and support, watch for breakouts, and learn to read the clues about what the market might do next.
Determine a Market’s Trend Using Price Action
Determining a market’s trend using price action is about recognizing the highs and lows. If you see higher highs and higher lows, you’re in an uptrend.
Conversely, lower highs and lower lows indicate a downtrend.
The manner in which we observe these patterns also matters. Every chart is a little different.
It might take some time for you to recognize key price action. Don’t worry, trust the process.
Determine Trending vs. Consolidating Markets Using Price Action
A trending market moves in a clear direction, while a consolidating market moves sideways.
By observing price action, you can differentiate between the two and adjust your trading strategy accordingly.
Price Action Trading Strategies

You know what they say: knowledge is power. Equip yourself with a toolbox of price action trading strategies to navigate the financial waters with confidence.
Very few traders actually make careers out of it. But the ones that do stack up on knowledge.
While there are numerous strategies for trading price action, it’s crucial to understand the role of Fibonacci retracement in technical analysis.
This tool holds a lot of weight in trade communities. It can help traders identify potential points of support and resistance by drawing horizontal lines at key Fibonacci levels.
It’s a valuable addition to any trader’s toolkit, helping to refine entry and exit points. Learn more about the Fibonacci retracement and how it can enhance your price action trading strategies.
I’m the author of tons of blog posts so my students have resources to learn.
How to Trade with Price Action Trading Strategies
Trading with price action strategies involves identifying patterns, predicting future price movements, and then placing trades based on these predictions.
It requires practice, patience, and a deep understanding of market trends.
The Most Effective Price Action Strategy
There’s no one-size-fits-all price action strategy, but there are effective ones.
For instance, trading breakouts of horizontal support and resistance levels can prove to be a powerful strategy.
But remember, it’s not about being right all the time — it’s about controlling your risk.
Is Price Action Good for Swing Trading?

Absolutely.
Price action is an excellent tool for swing trading, where trades are held for several days to catch price swings in the market.
With price action, you’re relying on pure price data, which is perfect for catching market swings.
How to Trade Price Action from Confluent Points in the Market
Confluent points in the market are areas where two or more levels intersect.
Trading from these points involves identifying them, waiting for a price action signal to trade, and then executing your trade with a stop loss in place.
Advanced Price Action Strategies
Advanced price action strategies involve complex techniques such as trading from Fibonacci retracement levels, trading divergence patterns, and trading head and shoulders patterns.
They require a solid grasp of price action fundamentals and are best left to experienced traders.
Price Action vs. Indicators
The age-old debate: price action or indicators? Which one’s better? Let’s dive into this contentious topic.
Price action and indicators are both essential aspects of technical analysis.
I included my favorite indicator below …

However, to make the most of these tools, it’s important to understand how different indicators work and when to use them. For instance, the Average True Range (ATR) is a volatility indicator that can provide valuable insights into market dynamics.
Discover more about the Average True Range and how it can complement your price action analysis.
Is Price Action Better Than Indicators?
This isn’t about better or worse — it’s about preference.
Some traders prefer the clarity of price action, while others like the additional confirmation that indicators can provide.
Use what works for you, and remember: all trading involves risk.
The Problem of Obvious Patterns and Their Profitability
Just because a price pattern is obvious doesn’t mean it’s profitable.
Markets are unpredictable, and what worked once might not work forever.
Always stay adaptable and ready to learn.
What Price Patterns Are Made Up Of
Price patterns are made up of highs, lows, breakouts, and the reactions of traders to these events.
Understanding these patterns can help you predict future price movements, but remember: trading isn’t about certainty, it’s about probability.
Pros and Cons of Price Action Trading

Like anything, price action trading has its pros and cons. It’s crucial to understand these before you dive in.
While price action trading has its advantages, it’s not the only approach to market analysis.
Day trading, for instance, involves making numerous trades within a single day, relying heavily on technical indicators to make informed decisions. If you’re considering this approach, it’s crucial to understand the basics and have a solid strategy in place.
Explore more about day trading indicators and how they can enhance your trading strategy.
Pros of Price Action Trading
The benefits of price action trading are clear: it’s flexible, it doesn’t rely on lagging indicators, and it can be applied to many different time frames and markets.
Cons of Price Action Trading
The downside? It can be subjective, it requires a deep understanding of market psychology, and it requires more discretion than trading with mechanical indicators.
Price Action in Different Time Frames
Price action can be applied in any time frame — from a 1-minute chart all the way up to monthly charts.
The choice depends on your trading style, risk tolerance, and available time.
What Is the Best Time Frame for Price Action Trading?
The best time frame for price action trading is a personal choice, but many traders find the daily time frame to be a good balance between market noise and significant price movements.
Practical Examples of Price Action Trading
Practical examples are a trader’s best friend.
Whether it’s a successful breakout trade, a perfect bearish pin bar at a key resistance level, or a false breakout that trapped overeager buyers, learning from real-world examples is invaluable.
Key Takeaways

The crux of the matter? Price action trading is a powerful tool in a trader’s toolkit.
It requires study, practice, and a dash of intuition. Remember, there’s no quick road to success in trading. Keep learning, keep adapting, and keep your risk in check.
Trading isn’t rocket science. It’s a skill you build and work on like any other. Trading has changed my life, and I think this way of life should be open to more people…
I’ve built my Trading Challenge to pass on the things I had to learn for myself. It’s the kind of community that I wish I had when I was starting out.
We don’t accept everyone. If you’re up for the challenge — I want to hear from you.
Apply to the Trading Challenge here.
Trading is a battlefield. The more knowledge you have, the better prepared you’ll be.
Do you use diamond pattern trading in your trading strategy? Let me know in the comments — I love hearing from my readers!
FAQs on Price Action Trading
Got questions about price action trading? You’re not alone. Here are some common queries and their answers.
How Profitable is Price Action?
The profitability of price action trading depends on the trader — their knowledge, their discipline, and their ability to manage risk.
With the right skills and attitude, it can be highly profitable.
Who Are the Most Successful Price Action Traders?
There are many successful price action traders out there, from those working in big banks to individual retail traders.
The common thread? They’re all disciplined, dedicated, and constantly learning.
Can Beginners Successfully Use Price Action?
Yes, beginners can successfully use price action. But don’t stop reading on this page …
Remember, trading is a marathon, not a sprint.
Start with a demo account, learn from your mistakes, and only risk money you can afford to lose.
Some software will allow traders to start without any funds at all. It’s called a paper trading account. That’s a decent option for a lot of traders.
How Do Price Action Patterns and Signals Help in Price Action Analysis?
Price action patterns and signals are fundamental aspects of price action analysis.
Patterns, like consolidation and reversal, help traders identify potential market turning points or continuation of existing trends. Price action signals, generated by candlestick patterns or specific setups like rejections or breakouts, provide real-time insights into the market sentiment.
Recognizing these patterns and signals can provide an advantage in making informed trading decisions.
It’s something all traders learn at some point in their careers.
How Does Momentum and Other Market Dynamics Like Supply and Demand Influence Price Action?
Momentum is a measure of the speed at which the price of an asset moves within a specific period.
It’s one of the critical factors influencing price action. Understanding supply and demand levels, reflected in buying and selling pressure, can also help identify price trends.
Other tools like the Relative Strength Index (RSI), Moving Average Convergence Divergence (MACD), and Stochastic can be used to understand market dynamics and confirm price action signals.
What Are Some Effective Trading Strategies for Price Action?
Effective price action trading strategies often involve identifying entry and exit points based on price action patterns.
Using a range-based approach can be beneficial in markets with no clear trend. Applying the rules of support and resistance, continuation patterns, and other methods like moving averages or the use of candlestick patterns can help develop a robust price action trading strategy.
What Resources Are Available for Learning More About Price Action Trading?
There are numerous resources available for learning about price action trading. In English and most other languages you could think of.
Various articles, newsletters, and guides offer in-depth information about price action analysis and its application in trading. Tools that allow for charting and method testing, like those found on trading platforms, can help with practical understanding.
Moreover, educational videos can provide a more interactive learning experience.
But pay attention to the distribution. Some people in this niche spout nonsense to fill their own pockets. Always check sources and reviews.
What Is the Role of Losses and Spreads in Price Action Trading?
Losses are a part of trading and can provide valuable lessons in managing risk and improving strategy.
The spread, or the difference between the buying and selling price, can impact the profitability of trades. And remember the spread price moves. It’s not a stationary factor.
Understanding the relationship between these factors and price action can help in making more informed trading decisions.
How Does Understanding a Price Action Chart and Its Elements Like Candlesticks and Bars Influence a Trader’s Position in the Commodity Market?
A price action chart, with elements like candlesticks and bars, provides a visual representation of price movements.
Understanding these charts can provide key insights into market sentiment, helping traders identify buying and selling opportunities in the commodity market.
Recognizing patterns in these charts can inform a trader’s position, whether it’s anticipating a trend continuation or preparing for a potential reversal.
What Research and Learning Resources Can I Access To Understand the Field of Price Action Trading?
There are numerous research materials and learning resources available for understanding price action trading.
Books, online articles, courses, and tutorials offer theoretical knowledge while interactive tools like trading simulators provide practical experience.
Also, keeping track of financial news can help you understand real-world market dynamics.
Joining trading communities and forums can also provide access to peer insights and expert advice. Members often collaborate and help each other grow.
How Do Organizational and Personal Factors, Like One’s Publishing Family or Career, Influence Their Approach To Price Action Trading?
Organizational and personal factors can significantly influence a trader’s approach to price action trading.
For instance, a trader who is part of a publishing family or works in a related career might have better access to information and understand market trends more quickly.
Similarly, personal traits like risk tolerance, patience, and ability to handle stress can influence trading decisions. Thus, it’s essential to consider these factors when developing a trading strategy.
How Do Different Trading Actions and Tools Like Buying Positions, Options, and Using a Lot Size, Contribute to the Results of Price Action Trading?
Trading actions like buying positions and using options play a crucial role in price action trading.
For example, entering a buying position at the right time based on price action signals can yield positive results.
Similarly, options allow traders to speculate on price movement without owning the asset, providing a way to profit from market fluctuations.
The use of lot sizes helps in risk management by determining the number of units traded. All these tools and actions can significantly contribute to the success of a price action trading strategy.
How Can the Understanding of Candlesticks Help Me Interpret the Seller’s Position in a Given Market Scenario?
Understanding candlesticks can be extremely beneficial in interpreting the seller’s position in a given market scenario.
For instance, if you see a long bearish (downward) candlestick, it generally indicates strong selling pressure.
On the other hand, a doji candlestick (where the opening and closing prices are nearly the same) could mean that the sellers are losing momentum and a reversal might be imminent.
How Does the Case or Trend of the Price Action Chart Inform My Trading Decisions?
The trend or case visible in a price action chart is vital for making informed trading decisions.
Traders typically look for patterns or ‘cases’ such as head and shoulders, triangles, or flags, to predict future price movements.
Recognizing these patterns can help traders to time their entries and exits to set stop loss and take profit levels effectively.
What Type of Results Can I Expect From Utilizing a Price Action Trading Strategy?
The results from utilizing a price action trading strategy can vary based on multiple factors like the trader’s skill level, risk tolerance, discipline, and market conditions.
Some traders may see consistent profits, while others may experience losses.
It’s essential to note that price action trading, like any other trading method, does not guarantee profits. However, with proper risk management, learning, and experience, it can be a viable trading method.
What Role Does Accuracy Play in Interpreting Price Action Charts?
Accuracy is crucial when interpreting price action charts.
The precise interpretation of price patterns, trends, and signals can help traders to make more informed decisions.
Conversely, misinterpretations can lead to trading mistakes and potential losses. Many traders use tools and indicators to increase their accuracy and confirm their chart readings.
How Do Personal Attributes Like Chance Taking, Sense of the Market, and Business Acumen Influence a Trader’s Results in Price Action Trading?
Personal attributes play a significant role in trading outcomes.
Traders willing to take chances might see significant gains from high-risk trades but could also face substantial losses.
A keen sense of the market, an understanding of its nuances, and a solid business acumen can help traders to better interpret market trends and price movements, potentially leading to more profitable trades.

Leave a reply