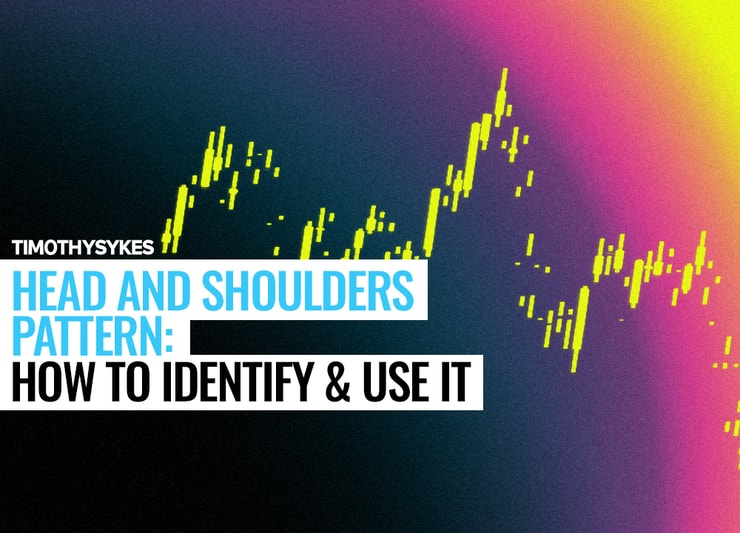
Traders have been using the head and shoulders pattern for decades … So what’s so great about this pattern?
With the right preparation, the head and shoulders pattern can be easy to spot. This pattern clearly shows the battle between buyers and sellers (bulls and bears). Why does that matter?
It indicates a change in a stock’s overall trend. And that can mean trading opportunities. Let’s break the head and shoulders trading pattern down now…
Table of Contents
- 1 Head And Shoulders Formation
- 2 What Is the Head and Shoulders Pattern?
- 3 Importance of Relying on Predictable Patterns
- 4 How the Head and Shoulders Pattern Occurs
- 5 Examples of Head and Shoulders Pattern
- 6 How the Head and Shoulders Pattern Works
- 7 Is a Reverse Head and Shoulders Bullish?
- 8 How to Identify and Use Head and Shoulders Technical Indicators
- 9 Trading the Head and Shoulders Pattern
- 10 Key Tips on Head and Shoulders Pattern Use
- 11 The Bottom Line
Head And Shoulders Formation
This pattern formation has three specific areas — two shoulders and one head.
At first glance, stock charts can look like a jumbled mess. But you can learn so much valuable information from these charts.
Here’s how it works…
Take a look at the chart below. To the untrained eye, it can look like a jumbled mess. But if you spend some time studying, you can see this pattern looks an awful lot like a head and a pair of shoulders. Wanna see these charts closer up? Just click any chart in this post to open it in a new browser tab.

Here’s what I see — a potential to trade.
What Is the Head and Shoulders Pattern?
Pay attention! Here’s the most valuable thing you need to know about the head and shoulders pattern:
It’s a bullish to bearish reversal pattern.
You see it when the stock’s price is going up, but the bulls ( buyers) are running out of steam. When the bulls can no longer keep going, the bears (or sellers) take over and dominate the trend.
The bulls don’t give up right away, though. They keep fighting, even though they run into more resistance.
The struggle for the bulls to overcome the resistance results in three visible peaks.
The second peak is higher than the first and the third peaks — that’s the head. The first and third price peaks are usually close to the same height — those are the shoulders.
Importance of Relying on Predictable Patterns
Way too many traders play in the markets like they’re in a casino. They place orders blindly, like desperate gamblers.
This is — to be blunt — stupid.
You may win a few ‘bets,’ but sooner or later you’ll go broke, like every degenerate gambler.

Be smarter than that. Learn smart trading rules and how to manage your risk. And you need to learn to trade using chart patterns.
The best traders don’t pick stocks at random. They have a reason for every trade. They look for chart patterns and other trading indicators that fit their strategies.
Nothing is 100% reliable. But so what?
If a pattern works 75% of the time (hypothetically speaking of course) and you can manage your risk … that’s all key to growing a small account.
How the Head and Shoulders Pattern Occurs
Like I said before, the head and shoulders pattern is a bullish to bearish reversal pattern. Shorts watch for this because it can signal that the price is likely to move downward.
Check out this chart for Delta Air Lines Inc. (NYSE: DAL). I’ve zoomed in on the version of the chart from earlier. Here’s the pattern showing the full formation:

#1 The Left Shoulder

To start, the price rises to a new high and forms a peak. That’s followed by a price dip.
Here, the stock’s price has been rising on a preexisting uptrend. When the bulls run into resistance that’s too strong to immediately overcome, you see a peak.
Buyers begin to sell, shorts begin to sell, and the price falls. That’s the first dip.
Together, the rise, peak, and fall in price form the pattern’s left shoulder.
#2 The Head
After the price reaches the bottom of the first dip. It moves up again, peaking higher than the left shoulder.
Shortly after making a new high peak, there are no new buyers and the selling begins again. The stock’s price slides lower again.
This forms the head, or the second peak, of the pattern. It’s the top of the bullish trend. After this peak, the second dip forms.
#3 The Right Shoulder
In its final act, the price rises once more to near the level of the left shoulder before it declines again for a final time. The DAL chart above is a perfect example — both shoulders top out at the same level just below $60.
With the right shoulder failing to break out to new highs, the bears have won the battle for now. The stock slides lower, breaking through the support level, making a lower low. It’s a confirmed breakdown.
Most importantly, the head and shoulders pattern is a signal to sell the stock if you’re already long. Or short if your trade plan is solid. (For the record, I don’t recommend shorting as a strategy for newbies or traders with small accounts. It’s a risky strategy.)
Chart patterns are maps of the battles between bulls and bears. That’s what makes them predictable. Behind every trade is a human action and human behavior doesn’t change.
Examples of Head and Shoulders Pattern
Let’s look at a few more examples to give you a better idea of what to watch for.
Example #1: TSLA
This example of Tesla Inc. (NASDAQ: TSLA) from 2017 is a little different — the shoulders are slightly uneven. But the pattern’s there and the price continues down after the second shoulder forms.

Example #2: TWTR
This chart of Twitter Inc. (NYSE: TWTR) is more recent, from 2019. The pattern’s nearly identical to TSLA. But the right shoulder is a little higher than the left shoulder. But the resulting downtrend is even bigger.

How the Head and Shoulders Pattern Works
The head and shoulders pattern marks the end of a bull run. It indicates the stock price is about to fall and it could be a time to short the stock. Or if you’re long the stock, it’s a strong signal to get out if you haven’t already.
Before you see the full head and shoulders, you may suspect the stock has reached its highs — but you don’t know for sure.
You want confirmation that the bullish trend has ended. By itself, the left shoulder is just a new peak and dip.
The next run up forms the head. That still looks like part of a bullish trend, because it’s a higher high.
The right shoulder is the true completion of the pattern. Once the third peak reaches a lower high and can’t go any further, this shows the bears are now in charge.
The bullish momentum runs out, so the price begins to fall. When the price crosses below the second dip that occurred between the head and right shoulder, the head and shoulders chart pattern is complete.
That’s your confirmation. The stock is headed down.
Reverse Head and Shoulders Pattern
This is simply the inverse head and shoulders — or the head and shoulders turned upside down. Everything is the same, but it looks more like a deep gorge with a shallow gorge on each side, instead of a head and shoulders.
This pattern also shows the struggle between bulls and bears.
But in this case, the stock has been in an extended bearish trend. Check out this chart of Zygna Inc. (NASDAQ: ZNGA):

The bears dominated heading into November, but the bulls begin to push back. That drives the stock up to form the first shallow dip.
The stock is in a downtrend making lower lows on each dip. In late November, there’s support in the form of a second dip that actually ends up as a double bottom. This is the head.
In late December 2019, the pattern confirms a reversal putting in a higher low for the third dip. This final dip completes the reverse or inverse head and shoulders pattern.
The pattern is nearly identical to the standard head shoulders, but the whole thing is flipped upside down.
The first two dips appear to be part of the bearish trend. Just like the regular head and shoulders, it’s the third dip that completes the pattern and confirms the trend reversal.
Inverse Head and Shoulders Pattern
The inverse head and shoulders is the same as the reverse head and shoulders. Some people prefer to say ‘inverse’ while others prefer ‘reverse.’
Double Head and Shoulders Pattern
There’s no such thing as a double head and shoulders pattern. You can have a double top pattern OR a head and shoulders pattern.
The key difference is where the peaks actually top out. When you have two peaks very close to the same price, that’s a double top.
When you have three peaks, where the middle is the highest and the other two top out at roughly the same area — that’s the head and shoulder pattern.
Let’s break it down a little further…
Pattern Components
So you now know the head and shoulders pattern is a bearish reversal pattern. What’s that really mean?
For a pattern to be a reversal, there must be an established trend to begin with.
A bearish reversal is only possible after a bullish run. The price must be in an uptrend for it to reverse downward.
So the first component of a head and shoulder pattern is an uptrending stock.
We’ve already covered the rest, the two shoulders and the head … A full head and shoulders pattern must have all these components. An uptrend, left shoulder, head, and finally a right shoulder.


Is a Reverse Head and Shoulders Bullish?
Yes. A reverse head and shoulders is a bearish to bullish reversal pattern.
It’s the exact opposite of the regular head and shoulders, which is bullish to bearish.
When you see a reverse head and shoulders you can expect the trend to turn bullish once the pattern is confirmed.
How to Identify and Use Head and Shoulders Technical Indicators
To identify a head and shoulders pattern, look for the three peaks that look like … well … a head and two shoulders.
There are three peaks and two dips. And the peaks and dips are the indicators when it comes time to trade this pattern.
If you short, you can generally wait for the third peak to form, then short when the price falls below the second dip. The top of the third peak can be a stop. But if the bears don’t take over, get out. Cut losses and don’t look back.
Head and Shoulders Pattern Breakout
There are two breakouts in a head and shoulders pattern.
The left shoulder and the head are both breakouts to new highs. You can trade these like any other breakout.
But the head and shoulders pattern is NOT a breakout pattern. It’s a reversal pattern.
Once the right shoulder forms, the confirms the reversal. Additional breakouts are unlikely, though not impossible.
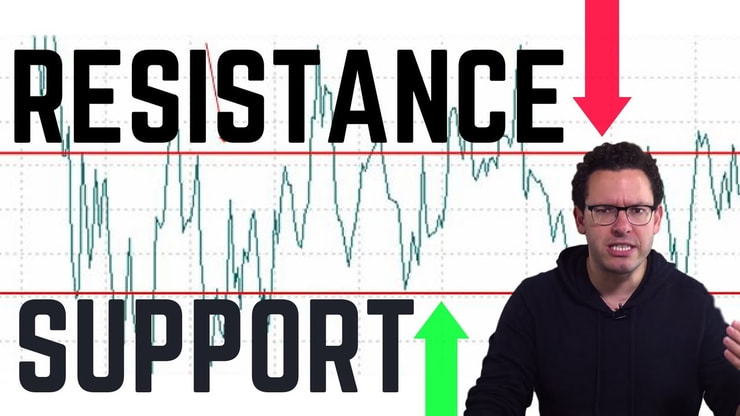
Support and Resistance Lines
The two most important lines you see on a candlestick chart are the support and resistance lines. Often, resistance turns into support and support turns into resistance.
Take a look at this example of China Jo-Jo Drugstores, Inc. (NASDAQ: CJJD):

There’s a clear line of resistance at $2.20. Notice how buyers push up to that level three times but fail to get very far past it. Each time the buyers push higher, the sellers push back down.
Finally, on the fourth attempt, the buyers push past resistance and breakout to new highs. After this breakout, the $2.20 resistance now acts as support.
The neckline, which we’ll cover in a bit, is another example of a resistance line. The neckline can sometimes act as support too.
Peak Analysis
The head and shoulders pattern is an example of peak analysis.
The three peaks that form can be strong indicators of what’s to come. They can also act as the basis for your risk.
I use StocksToTrade every day for charting, technical analysis, scanning, and finding the hottest trading opportunities. I helped develop it, so the built-in scans are perfect for penny stocks and my trading patterns. Plus, this new feature is helping me find killer trades in this market. It helped me on my best trading day of 2020 yet!
Head and Shoulders Top
The head of this pattern is the absolute highest peak the bulls manage to reach.
It’s not always clear as it’s happening. Often it looks like the stock is continuing its upward climb.
It’s only after the second shoulder forms that the top of the pattern is apparent. So never try to guess the top. Wait for the confirmation of the second shoulder to confirm your suspicion.
Head and Shoulders Bottom
The bottom is the area of support that forms at the bottom of each shoulder. Again, it’s not always a clear line. That’s why I’m calling an area, not a line.
The breakdown below this area of support is the completion of the pattern.
I always react to price action and never try to predict. Never try to pick a top or bottom. Only react to what the market’s telling you.
Head and Shoulders Neckline
The neckline of the head and shoulders pattern marks where selling pressure overcame buying pressure on two of the three peaks.
The neckline is above both shoulders and below the head — just like on a person. Remember the DAL chart from earlier? Here it is again with the neckline:

Head and Shoulders Pattern Target Price
You need to plan your trades, including a target price where you’ll take profits and get out.
How much profit can you reasonably expect from the head and shoulders?
That all depends on the stock and your strategy. Remember though … singles add up and you have to cut losses quickly.
Look back to the long-term chart where the head and shoulders pattern is forming. Where’s the last support level below? That can be a price target.
It’s not easy, but you can improve with practice. So study up. Be prepared to act on these patterns when you see them in live trading.


Trading the Head and Shoulders Pattern
A chart pattern on its own is only one piece of the puzzle. I have seven items on my checklist that I review before entering any trade. Learn my seven-step pennystocking framework here.
Whenever you’re considering a trade you need to consider the whole picture — from the catalyst to the time of day. Never trade on a single piece of information on its own, not even a ‘perfect’ chart pattern.
Always be ready to be wrong.
Anything can happen at any time in the market. Every successful trader knows when to cut losses and walk away.
I trade by and teach certain rules. Rule #1 is to cut losses quickly. And it’s the most important — that’s why it’s rule number one. Small losses are OK and part of the process. A big loss can bankrupt you.
Key Tips on Head and Shoulders Pattern Use

The head and shoulders pattern can be reliable, but it can still give you a false signal. So again, be ready to cut your losses.
The key is to recognize the pattern in the first place. In real-life trading, it isn’t always clear. Studying is key to learning to spot these patterns.
One key tip: The pattern often performs better when the peak of the left shoulder is higher than the peak of the right shoulder. Like in the TSLA example we looked at earlier.
Always Use a Stop Loss
Set a stop loss!
I’ve said it a million times. I say it in my sleep. I dream about telling my students to set stop-loss orders.
When I’m on my deathbed, it’ll be my famous last words. Always set a stop loss.
The head and shoulders pattern is powerful and reliable, but nothing works perfectly every time.
Before you enter the trade, know when you’ll cut your losses.
Never Trade too Big
You need to protect your trading account by closely managing your position size. Never risk too much money on any one trade — no matter how fantastic the setup looks.
No trade is guaranteed.
Going ‘all in’ on a trade by risking all your money might look cool in a movie, but in real life, it’s just plain stupid.
You might win a few times, but sooner or later you’ll blow up your account. I almost never risk more than 1% of my trading account on one trade.
You have to establish your own risk management, but I recommend you keep your positions below 20% of your trading capital. Keep your risk as close to 1% of your account as possible.
Improve Your Stock Market Knowledge
Wanna be a smarter, self-sufficient trader? Invest in your knowledge account.
You need to be able to read stock charts FAST. You gotta know these patterns inside and out. When you can see where the stock has been, you can better understand where it might be going. So you have to study the past.
You also have to understand your own psychology. Keep cool. Stay in control of your own mind and emotions.
All that comes with experience. So keep watching my videos, maintain your trading journal, and learn from my top students.
Trading Challenge
I love the markets, and I love trading them.
But after I earned over $5 million trading, I discovered I loved teaching other traders even more. I want to help them fulfill their dreams and live the life they want to live by learning how to be self-sufficient traders.
I still love to trade and make money. Only now I donate all my trading profits to charity. I trade to teach my students how to grow a small account. I use the same patterns I’ve traded for over 20 years.
That’s why I’m inviting you to join my Trading Challenge.
Apply now if you’re truly dedicated and ready to commit. I’ve had tons of new applicants with the markets going crazy right now. Not everyone will get accepted. I only want to work with students who are truly ready for this.
Apply here if you think you have what it takes.
The Bottom Line

There’s a simple reason the head and shoulders pattern is such a common chart pattern for traders. It’s reliable.
You likely won’t see it happen frequently, but keep an eye out for it. Make it part of your trading kit.
It’s just one tool for you to master. You still need to know all the other important chart patterns and trading indicators too. Never rely on any single trading signal.
But this is one pattern I think every stock trader should know and recognize.
What do you think of this pattern? Leave a comment below!

Leave a reply