My head hurts just thinking about this stuff. I wanted to say that right up front because…
… even though I’m about to explain Moving Average Convergence Divergence — I don’t use most of the advanced technical indicators when I trade. I like to keep things simple.
So, why bother? One of the big lessons I teach Trading Challenge students is you have to figure out the trading strategies that suit you. I want you to become a self-sufficient trader. Some of my students use MACD and other advanced technical indicators. If it suits your trading strategy then use it.
This guide will give you an idea why the ‘Mac-dee’ might be useful. Onward…
Table of Contents
What is Moving Average Convergence Divergence (MACD)?

The MACD is a technical indicator calculated by subtracting a slower exponential moving average (EMA) from a faster EMA. The resulting MACD line is then plotted against an EMA of itself. The EMA of the MACD line is called the signal line …
… see why my head hurts thinking about this?
That said, you know I’m about to give you the push to study, study, study. Don’t discount the MACD. Some traders consider it one of the most reliable of technical indicators. It’s all part of the learning process.
Back to it.
If you don’t know how an EMA works, you might want to read this post I wrote about moving averages and how to calculate them. The simple way to think about a moving average is that it smoothes out price data over time. An exponential moving average gives more weight to recent price movements.
Traders compare short-term and longer-term EMAs to determine bullish or bearish momentum in a stock’s price action. If the short-term EMA moves above the longer-term EMA, it means the recent rise in price is faster than in the past. If short-term EMA moves below the longer-term EMA, it means recent drop in price is faster than in the past.
So, why the MACD if you can already gauge momentum with EMA crossovers? The MACD analyzes the difference (divergence) between the two EMAs as a way to gauge the strength of price momentum.
This brief guide to the MACD indicator only scratches the surface. You should consider joining the Trading Challenge if you’re serious about trading. Preparation is key. Join the Trading Challenge and then get to work.
Back to the ‘Mac-dee.’
The standard MACD indicator subtracts the 26-day EMA from the 12-day EMA. This calculation produces the MACD line on a chart (example below). The signal line is the 9-day EMA of the MACD line. If the display includes a histogram, it’s calculated by subtracting the signal line from the MACD line.

Rather than go into long explanations about how to calculate this and make you think you need to be good at math (I’m not!) …
… so let me allay your fears: Most good modern charting software includes the MACD indicator as an option.
Let’s take a look at a chart — created using my favorite stock screening and charting software, StocksToTrade. The chart below is Fannie Mae (OTCQB: FNMA). I’m using this chart because some of my students made excellent trades on FNMA recently.
I even got on board and dip bought this off its highs for a small gain of $249.** My student Dom (read Dominic’s 6 Simple Trading Tips here) reported that he made a huge gain of $23,000** on this! Hats off to Dominic. He’s studied like crazy.
Anyway, back to the chart:
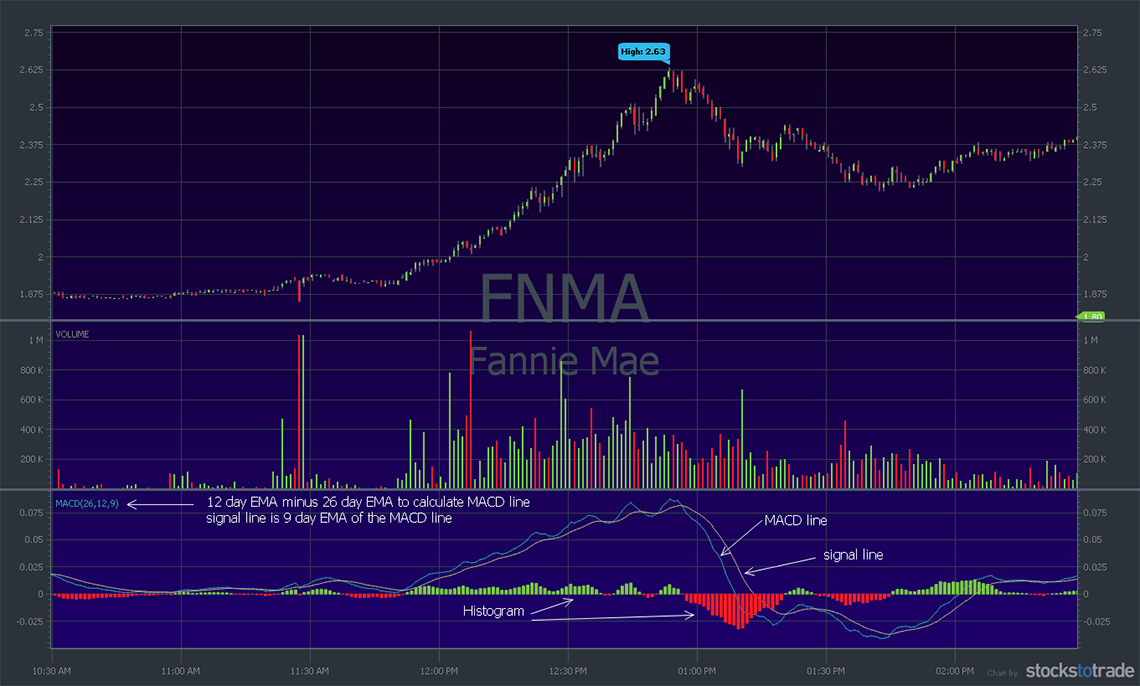
Look at the lower section of the chart. The top arrow and text (pointing to the left) explains the MACD is calculated using 12- and 26-period EMAs with a 9-period signal line. The other arrows and text point to the MACD line, the MACD signal line, and the difference line histogram. Traders use this indicator to help determine buy or sell signals and to confirm or deny their trade thesis.
Benefits of Using MACD Indicator While Day Trading

There’s some disagreement within the trading community about the usefulness of the MACD for day trading. Some traders — especially swing or momentum traders — think the MACD is not dependable for intraday trading. They say it’s better for longer-term charts.
Are they right?
I caution you against blindly accepting what other traders say when it comes to using technical indicators. Some traders love them and others don’t. It depends on your trading style and strategy. The best thing you can do is learn how the indicator works.
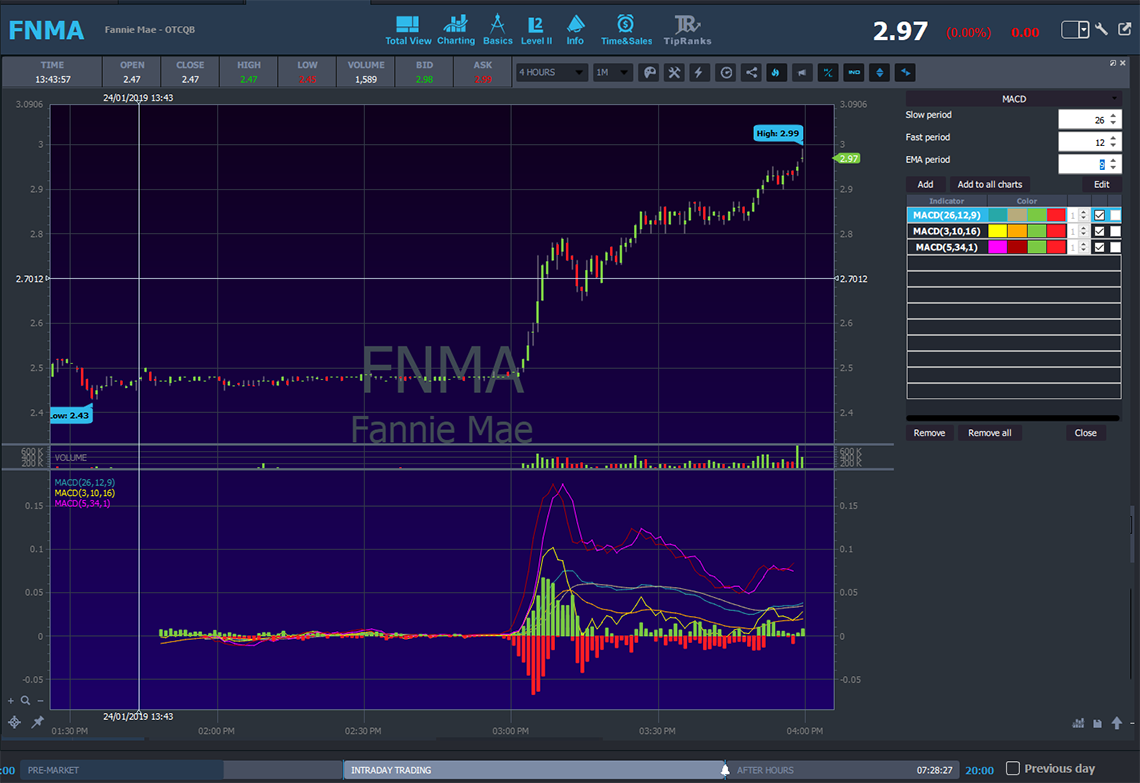
For day trading, you might want to consider using different time frames with the MACD. Because day traders focus on intraday price action, it makes sense to tighten the time frame. Instead of 12-period, 26-period and 9-period MACD(12,26,9) you could try one of the more common settings for intraday trading: MACD(3,10,16) or MACD(5,34,1).
Take a look at the FNMA chart below. I’ve used the three different MACD sets above with different colors for each line. I took a screenshot rather than using the export tool so you see how easy it is to set up custom indicators on StocksToTrade. I left the histogram colors the same to keep things simple.
Notice how different the MACD lines are when using different time periods. The point of this chart is: Using different parameters greatly changes the outcome!
Another word of caution: You could spend a lifetime trying to get the perfect setup for technical indicators. You could go for a PhD in finance and write your dissertation on one technical indicator …
… you could play with this forever and never put it to use or actually make a trade. Personally, I’d rather study, become self-sufficient, and take a trip to Thailand. You?
MACD and Penny Stocks
Is the MACD a useful indicator for penny stocks? Because it’s a momentum oscillator (I’ll explain more about that in a minute) some traders think it’s more useful in non-trending markets.
As a penny stock trader, I look for big price action, trading volume, and volatility. During big price movements, MACD could be useful to determine if a stock is overbought or oversold. It’s not what I use but that doesn’t mean it’s not useful.
Like anything else you do, test your thesis by paper trading in your StocksToTrade account before you use it live. Dial it in. Get it right before you risk your hard-earned cash.
Before we go a little deeper on how to read the indicator there’s one more thing you need to understand. Moving averages and all their variations are based on past price action. In other words, while they give you some idea about momentum and help smooth out price action, they do not predict the future.
It requires past price data to create the EMAs and from them the MACD. It requires past MACD data to create the signal line. Are you getting the picture?
This is why I tend to look at other criteria such as:
- Current price action: how is it moving right now?
- History of a stock’s behavior: is it a past or recent runner?
- News catalysts: what’s driving the price action today?
How To Read MACD Indicator in 5 Easy-to-Follow Steps
#1 Understanding Each Line
There are three parts to the MACD indicator. Let’s take a look at each and then we’ll look at how they interact and what it might mean for trading.
The main MACD line is the difference between the 26-period (usually days) and 12-period EMA. If you look at the chart below you’ll see that in general, the MACD line follows the trend of the stock price. Since the stock’s price is a little choppy, the MACD line is choppy.
The signal line (sometimes called the MACD signal line) is the 9-period EMA of the MACD line. It smoothes out the MACD line. The reason it’s called the signal line is because it signals traders when to buy and sell. I’ll explain this more in #4 below.
The third part of the MACD indicator is the divergence line or zero line (depending on which convoluted definition you pay attention to). The reason the MACD is considered a momentum oscillator is because it oscillates around the zero line.
Crossovers
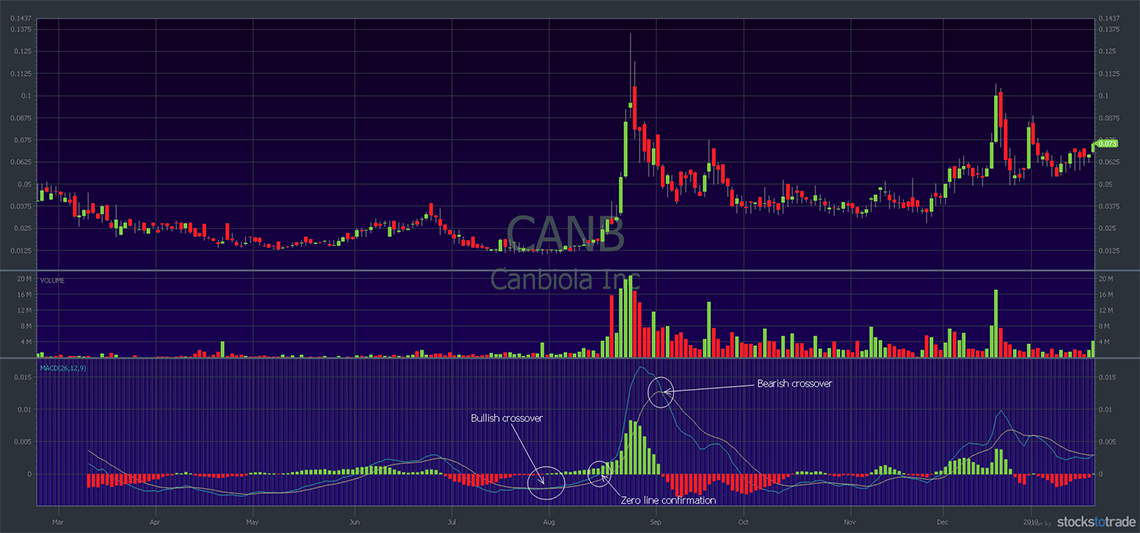
Crossovers occur when the MACD line crosses above or below the signal line. When the MACD line crosses from below to above the signal line, it’s called a bullish crossover. When the MACD line crosses from above to below the signal line, it’s called a bearish crossover.
Take a look at the Canbiola, Inc. (OTCQB: CANB) chart below. I’ve indicated where both bullish and bearish crossovers happen. I’ve also indicated where the MACD line crosses above the zero line. A zero line crossover or confirmation is not considered as ‘strong’ as a signal line crossover. But it provides further evidence of a shift in trend.
Divergence
Divergence can apply to three different things with MACD. Built-in divergence, the ‘D’ in MACD, is exhibited by the MACD line itself. The further apart the two underlying EMAs used to calculate MACD are, the more rapid the rise or fall of the MACD line.
The second divergence is the difference line shown as a histogram. The greater the divergence between the MACD line and the signal line, the longer the histogram bars.
The third divergence is when the MACD line and the price move in different directions. In other words, the MACD line does not conform to price movement. See why sometimes this stuff makes me use profanity? (Which I’ll avoid now. Let’s keep this clean … for once.)
#2 Rapid Rises/Falls
Traders use rapid rises or falls in the MACD line as a signal the stock is overbought or oversold. When stocks are overbought or oversold, it is generally accepted volume traded will return to ‘normal’ levels. Price action should reflect this. It goes back to supply vs. demand.
Some traders combine the MACD with other indicators to confirm overbought or oversold conditions. The most common technical indicator for this purpose is the Relative Strength Index (RSI). The RSI is a popular momentum oscillator designed to determine overbought or oversold conditions.
#3 Interpret MACD Parameters
Once you understand the parameters used to calculate MACD, you can adjust them to fit your trading strategy. Look back at the FNMA chart above with three different MACD setups on it. When you change the parameters, it changes how closely the MACD lines follow price action.
I recommend you study some charts with EMAs, the corresponding MACD lines, and enough price action to see how things mesh. Remember, it’s easy to get caught up in technical indicators only to miss the bigger picture. These are tools — no matter what anyone says it’s not an exact science.
Example of a MACD Parameter
The MACD parameters are the EMAs described above: fast EMA, slower EMA, and EMA of the MACD line to calculate the signal line. The default values are 12-period, 26-period and 9-period.
Wonder why those numbers?
When Gerald Appel developed MACD in the late ‘70’s, the markets traded half-day on Saturdays. 12 sessions represents two weeks, 26 sessions represents a month, and 9 sessions a week and a half. Interesting, huh?
Why not change the default to suit the 5-day trading week? Old habits die hard. Psychology. Stubbornness. Whatever.
All the more reason to study history. When MACD was developed, almost all technical analysis was done using daily charts. They didn’t have StocksToTrade or even Yahoo Finance. Bonus for you. Try changing the parameters and test your thesis.
#4 Best Moment To Place a Buy Order
There are two buy signals when using the MACD. The primary buy signal is when the MACD crosses above the signal line. The idea is momentum has shifted to the upside. It’s called a bullish crossover by MACD enthusiasts. It’s graphically represented by the histogram moving above the zero line.
The other buy signal is a confirmation of momentum based on the zero line. Say the MACD line is below the signal line and both are below the zero line. Then the MACD line moves above the signal line. This is a common buy signal, right?
Some traders wait for the MACD line to also break above the zero line as confirmation of momentum shift. You can see an example of this (labeled zero line confirmation) on the CANB chart above.
#5 Best Moment To Place a Sell Order
The best time to place a sell order using MACD is similar to buy orders. When the MACD line drops below the signal line it signals a momentum shift to the downside. It’s called a bearish crossover.
Using the MACD Indicator to Spot a Reversal
I’m taking a deep breath here and … a nice long sigh …
Why, you ask?
If it was possible to spot a reversal — and nail it every time — that would be a superpower worthy of spandex and a cape. And a cool name. You could rule the universe. Or at least the markets. You’d go down as the greatest trader of all time…
Guess what I’m going to say?
Study. Study. Study.
Remember, moving averages and all their variations are trailing indicators. It might be more accurate to use the MACD to confirm a reversal than to spot one. Here’s where traders use the concept of divergence to make an educated guess about possible reversal.
If the MACD is moving one direction and the price is moving the opposite direction, it’s a sign that momentum has slowed and a reversal could be in the making. Sounds like I’m hedging a bit, doesn’t it?
Just tryin’ to keep it real and keep you from falling into, “But the indicator signalled a turn and then it didn’t turn and I blew up my account.”
It might sound funny but it’s not so funny to the trader who does it. Always remember Rule #1: Cut losses quickly. There’s no rule in my book that says trust the indicator and blow up your account.
Tips To Developing a MACD Trading Strategy

Visit the golden arches for breakfast? (Reason I don’t have billionaire friends: bad jokes.)
Use MACD Along With Other Indicators
I mentioned this above but it’s worth repeating: use the MACD along with other indicators. I’m going to ‘pan out’ for a second and give you a big picture tip. This applies to technical indicators, planning your trades, and almost everything else about trading.
No aspect of a trade exists in a vacuum.
What do I mean by that? If you rely on only one thing to determine what to buy and when to buy … good luck.
Indicators are one part of a bigger picture. Most traders who use technical indicators successfully use more than one. Or they use the indicator in conjunction with something else — like news or fundamentals.
The most common indicator to use with the MACD is the RSI.
Test Your Trading Thesis With Paper Trading
Picture this scenario: newbie trader learns about MACD. Newbie trader looks at 10 charts and they all tell the same story — buy when this happens and sell when that happens. Newbie trader is absolutely sure of success. Newbie trader jumps in a trade based on studying 10 charts and the ins-and-outs of MACD. Newbie trader….
… wins? Or loses?
Honestly, who knows? I do know this: it would be a much better idea to test your thesis with a lot of paper trades (using StocksToTrade, of course) first.
Then, assuming everything works right with the paper trading, start small. Make several small trades to test your new thesis in real-time with real money. Remember rule #1: Cut losses quickly. Only if your thesis pans out after several paper trades and several small trades should you consider larger positions.
Don’t Trust in Stock Promoters


Stock promoters….
… the stereotypical used car salesman in a cheap suit is more trustworthy. That’s an opinion, by the way. No offense meant to used car salespeople.
Stock promoters get paid to promote stocks. That’s it. They make money by making sure word gets out about the greatest new product since …
… I don’t know, name a product or idea that changed the world. Sliced bread. Sunglasses. Electric cars. Whatever.
Promoters don’t have your best interest at heart. You have no idea how many lists they promote to, or which list you are on. You have no idea if there’s a plan to dump huge blocks of shares once the price hits a certain predetermined level.
Should you completely ignore them? No, but be clear of the part they play. They might say something like, “This is the next Microsoft.” It’s not. But if they say it enough and everything else lines up right, the stock might make a brief run. As a day trader, you can use that.
Always Seek To Improve Your Knowledge
I hope this is clear. The stock market is unforgiving. It’s a battlefield. The weapon of choice is knowledge and an excellent way to improve your knowledge is with the Trading Challenge.
What do you get? Live trading webinars, live lessons with Q&A, monthly bonus webinars with Tim Grittani and Michael Goode, the challenge team chatroom, access to Profit.ly …
… I could go on because that’s not all.
But the best way to see if you are a good fit for the Trading Challenge is for you to apply.
You’ll get access to a few videos and then you’ll be contacted by someone on my team. It’s not for everyone, but if you’ve read this far you’ve already shown your determination. Apply today — it could end up being one of the best decisions you’ve ever made.
The Bottom Line

By now you know that I prefer to keep things simple but…
… I also believe that preparation is key and education is the answer.
The MACD is one of dozens of different technical indicators. You should learn how it works and play with it in your charts. When you create your daily watchlist, why not pull up a chart or two and add the MACD indicator to see if it fits your strategy?
Like all technical indicators, the MACD is useful to the degree you understand its limitations.
Are you a trader? Do you use MACD as part of your trade setups? Comment below and let other readers know. New to trading? Comment — I love to hear from you!

Leave a reply