Tesla, Inc (NASDAQ: TSLA) is constantly in the media spotlight. It’s not always favorable attention … but a lot of people just won’t shut up about Elon Musk or his company.
Some short sellers especially love to bash Elon and his company. They’ve done it for years. They don’t believe in his vision. The $TSLAQ shorts are almost cultish.
I hate to see anyone lose money … But TSLA short sellers were basically asking to be destroyed.
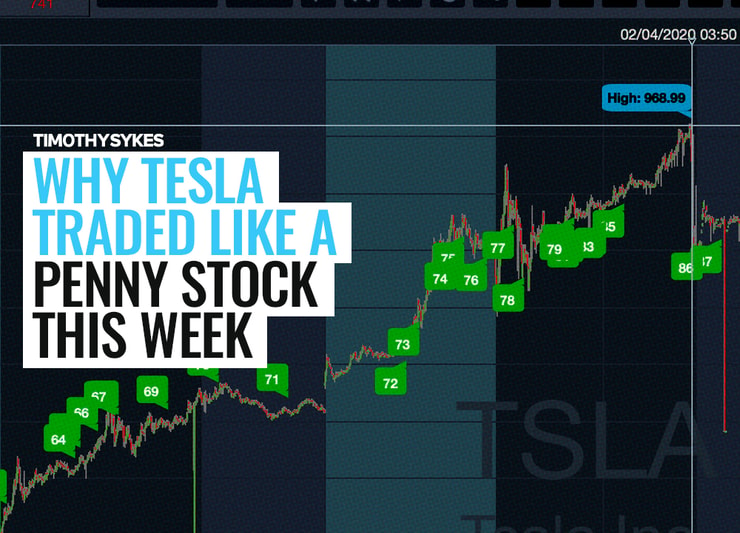
In four days, TSLA spiked nearly 60% — costing short sellers $8 billion. I can’t remember the last time I’ve seen a mega-cap, $100-billion-dollar company move so much in a short period.
You’re lucky if you get a 10% move on blue-chip or FANG stocks in an entire year.
On February 4, TSLA topped at $968.99 a share. That gave it a market cap of over $153 billion. That’s double the market cap of General Motors Company (NYSE: GM) and Ford Motor Company (NYSE: F).
This historic 2020 run crowned TSLA the largest automotive company in the world.
Table of Contents
What Started TSLA’s Recent Run?
TSLA reported Q3 earnings after the close on October 23, 2019. The numbers were great, and that excited investors about its future growth. Check out the six-month chart:

You can see the company’s clear uptrend after the report. But the short sellers piled in anyway. One of the smartest lessons you can learn as a day trader is to not fight a stock’s trend. As the saying goes…
“… the trend is your friend…”
… but some degenerate short sellers never learn. As TSLA spiked, they got more and more desperate. I saw a lot of $TESLAQ tweets ragging on Tesla. They try to make it seem like TSLA is going bankrupt.
When a ticker symbol ends in a Q, it means the company is going through bankruptcy. Some of these shorts will do anything to try to push a stock down.


TSLA accumulated a lot of short sellers following the Q3 earnings report. They helped create a perfect storm for a short squeeze. After the close on January 29, TSLA reported Q4 results and beat expectations … again.
Eager investors and twisted short sellers spiked the stock up $60 a share overnight. It opened at $640 the next day. The earnings gap up was only the beginning … With two positive earnings reports, TSLA shorts were in deep trouble.
In the following four days, the shorts got destroyed … and TSLA might not be done. I don’t really know — it’s outside of my niche. But I love how TSLA has been trading like a penny stock, which brings me to…
Pennystocking Framework Review

Students in my Trading Challenge should be very familiar with my “Pennystocking Framework” DVD. It’s core to my education program. It teaches students how to look at the big picture to understand the stages of a supernova run.
Here’s a great review of my guide over on Investimonials.
Years ago I noticed penny stock pumps followed a seven-step framework. That’s when I created the first guide. They weren’t always exactly the same, but close enough. I developed a system of playing pumps both long and short.
Then I decided to update it with “PennyStocking Framework Part Deux.” The Part Deux edition is more current. Remember, patterns change over time. The general pattern is still the same, but there are some slight variations.

Long-biased traders focus on steps 3 (the supernova) and 5 (the dip buy) — which you’ll learn when you purchase “PennyStocking Framework Part Deux.”
Tesla has followed this framework very closely, but at astronomical prices compared to penny stocks. It just goes to show that pennystocking strategies sometimes work with real companies at high prices.
Where Does TSLA Fit in the Pennystocking Framework?
For large-cap companies, the pennystocking framework isn’t a perfect fit. Since TSLA has a sound business, it won’t follow the last few steps.
But so far, TSLA perfectly follows the first four steps of the guide. I anticipate a #5 pattern (the dip buy) very soon.

On February 5, it had a surprising #4 pattern (the cliff dive). But I wasn’t gonna try a morning panic dip buy. It would’ve worked, but it’s outside my main niche.
That’s honestly one of the biggest mistakes I see new traders make: they chase hot stocks outside their niche. Until you’re consistently profitable, focus on one or two setups. If you step outside of your niche before you’re ready, it can be a recipe for disaster. I’ve seen it far too many times.
I repeatedly warned my students to stay away from TSLA. You never know how high a short squeeze can go. Frankly, I was scared of TSLA. I was focusing on the uptrend and thinking it could see $1,200 or $1,500 on a parabolic spike.
Some of my top students didn’t listen — but that’s OK. They understand the patterns and cut losses quickly.
My Students Crushed TSLA
Here’s a quick shout-out to some of my students** who nailed TSLA both long and short. I’m so proud of my students who recognized the pattern…
From the Trading Challenge Chat Room

February 3
4:10 PM markcroock: never thought id say this but top potential short $TSLA supernova pattern looking like it belongs in pennystocking dvd
February 4
9:50 AM migtrader: $TSLA rocket is going
10:17 AM markcroock: $TSLA setups is OPTIONS WET DREAM
10:35 AM kroyrunner: if $TSLA follows the $FNMA pattern, this is day before the collapse
3:15 PM NEOTHEONE: GO LONG $TSLA OR GO HOME..lol
3:20 PM kroyrunner: I 1000% agree $TSLA could go to $1500 or more and there’s 0 room for stubbornness, let me just be clear on that
February 5
9:33 AM markcroock: sold $TSLA puts +16k
9:46 AM Chriz787GWIFOM: $TSLA acted just like an OEGD crazy
10:09 AM markcroock: left 25k on the table so far $TSLA lol
10:39 AM Androo: $TSLA covered all $753.22 & long 9 shares now
10:41 AM Itspayday: $TSLA pump and dump ?
10:55 AM ranjan_ojha: Made a quick 211$ on $TSLA dip buy. Thanks Mark!
1:17 PM 53ericwilliams: flat on $tsla for another +450
4:35 PM olegnusinzon: That’s a hell of a “first red day” for $TSLA
Think you can cut it in my Trading Challenge? Apply today and find out.
More Comments From the TimAlerts Chat Room
February 5
10:42 AM tommy888g: $TSLA the biggest Penny Stock … I think price action is straight from “frame work DVD” do I’m right?
11:12 AM quantum: $TSLA chart looks like a pump and dump
11:15 AM kondash4 → quantum: That is pretty much what happened. People “pumped” it by buying the shit out of it. Killing shorts along the way (more buying). Add in all the FOMO buying. We watched $TSLA go Supernova
12:42 PM amsbeats: 7.62 to 7.59 $TSLA short
1:41 PM Moshe2000: $TSLA has been an incredible stock to trade. What a chart!
2:08 PM Mark9565: $TSLA was phenomenal. I had bought when they announced profit and made about $50 per share, only to flabbergasted to watch it skyrocket. Then yesterday bought AT $887 and sold at $905 only to be more flabbergasted.

TSLA Analysis From My Top Students
I warned my students that TSLA could get crazier than people think. But some of my top students took advantage of TSLA on the short side after it topped out in the high $900s.
Jack Kellogg (aka Jackaroo on Profit.ly)

Jack traded TSLA a few times this week. I’m so proud of the trader he’s becoming. He continues to expand his trading strategies and remains consistently profitable despite a slower OTC market.**
My trades on $TSLA the last 3 days.
Played it safe and nailed entries and exits. 🙏
Cute $2,000 on the name..
first time trading a stock this priced. pic.twitter.com/yiPjLg1ji7— Jack Kellogg (@Jackaroo_Trades) February 5, 2020
I asked Jack to explain these trades to help everyone understand his thought process. Here’s his breakdown of the trade:
The first trade chart in my tweet was based on the overextended gap down strategy Tim Grittani talks about in “Trading Tickers.” TSLA’s daily was parabolic on a huge volume. On February 4, there was a huge snap into the close. That was the first sign the short-term top was in.
After hours it failed to bounce and stay above $900, so I started short, risking the $920 area. The next morning I added on the gap down. That confirmed a possible first red day. It also let me move my risk to $900 so I could add more size.
Once I scaled in I just stayed patient and kept the focus on my risk. Immediately after the open TSLA pulled and I covered into the gap-fill $780 support area for a sweet risk/reward play.
The second chart is an intraday of TSLA on February 3. This was the first day TSLA started to go supernova. It spiked $100 at the open … But I wanted to wait for confirmation before blindly shorting the strongest stock in the market.
I saw some stalling at the top and started to size in slowly. My plan was to risk the high of the day and cover into the VWAP, which was 30 points away. I wasn’t going to overstay my welcome. It was still the front side of the move.
The last chart I added to be transparent. TSLA wasn’t an easy trade on February 4. So I cut my losses quickly and waited for more confirmation. In total, I profited $2,000 on these three trades and I’m very happy with my executions.
You can check out all of Jack’s trades here. He’s closing in on the $200,000 mark. Keep it up, man!
Kyle Williams (aka Kylecw2 on Profit.ly)

My newest six-figure student, Kyle Williams, took a similar approach to Mr. Kellogg. Kyle focused on the first red day pattern.
Here’s Kyle’s TSLA trading plan:
My thesis was that Tesla offered a rare opportunity that doesn’t come around often. Basically, there’s an extreme supernova/bubble. TSLA was following the same footsteps as Bitcoin in 2017 and TLRY in 2018.
They’re all different companies — even different asset classes in Bitcoin’s case — but they ended up acting the same at the climax of the hype. My goal was to time the ending of that hype/supernova. Once TSLA started to show signs its hot run was ending, I started to short.
Really thought I could be patient for a day or 2 for sub $700 but when you get this much of a move in just half a day I can’t help but take it. $TSLA pic.twitter.com/286t8ZE6me
— Kyle Williams (@traderkylec) February 5, 2020
Kyle explained at the 2019 Trader and Investor Summit (get the DVD here) that he was transitioning from prominently OTC trades to trade more listed stocks. He studies and works his butt off — awesome trade Kyle!
Check out all of Kyle’s trades here.
Other TSLA Trades From My Students
#Playoftheday$Tsla – #Overextendedgapdown pic.twitter.com/6EiGvSjch5
— H𝙪𝙙𝙙𝙞𝙚 (@MikeHuddie) February 5, 2020
Made $747 on $TSLA put! First triple digit gain!!!! So PUMPED!!! Thanks @thehonestcroock @timothysykes #daytrading #marathonnotasprint
— OgletineTrades (@OgletineT) February 5, 2020
[**Note that these results aren’t typical. It takes time, dedication, exceptional skills, and knowledge to trade well. Most traders lose money. Always remember trading is risky … never risk more than you can afford.]
What’s Next for TSLA?

I’ve gotten dozens of messages and seen hundreds of people on social media talking about TSLA. Some people were asking if it was a good buy in the $800s or $900s…
… if you have to ask social media, stay away from the stock. Do your own research and develop your own trading plan.
TSLA has followed the Pennystocking framework beautifully but remember … TSLA is a real company. It won’t fade into oblivion like sketchy penny stocks.
Plenty of short-sellers are still underwater … Could TSLA squeeze higher? I’ll certainly keep a close eye on it in the coming weeks.
Conclusion
Anything stock that spikes 50% or more in a short period has a high chance of retracement. Once TSLA pulls back for a few days, who knows where the stock could go…
It’s important to always keep an eye out for crazy moves. These moves can happen in any price range.
Also, remember to learn from the past. Kyle referenced several historical supernovas he missed. But he still learned from them, that helped him nail TSLA.
Study the chart and prepare for the next supernova — apply for my Trading Challenge today.
Tell me what YOU think of TSLA … Where will this stock go next? Leave a comment!

Leave a reply