The difference between bullish and bearish is simple: ‘bullish’ traders believe that a stock or the overall market will go higher, and ‘bearish’ traders believe a stock or the overall market will go down, or underperform.
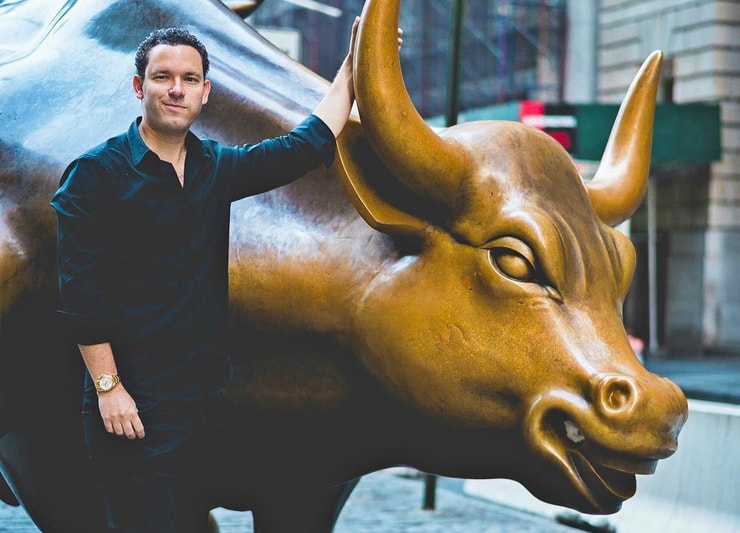
Bullish vs. bearish markets: how well do you understand the difference?
When you start trading, you can hear some strange market lingo. After the market crash and coronavirus pandemic, two terms seem to stand out even more: bull market and bear market.
The market’s extremely volatile these days. So it’s even more crucial that you understand the basics, like bullish vs. bearish.
Personally, I think the market was long overdue for a correction after over 10 years of a bull market. I didn’t anticipate this kind of volatility. But I’m still prepared to trade through it — and to teach you how too. Access my no-cost, two-hour “Volatility Survival Guide” to learn how to ride the wild momentum.
As for the bullish vs. bearish definition … let’s dig in to better understand these terms and what it all means for your trading.
Table of Contents
How Did the Bull and Bear Markets Get Their Names?
Legend has it that in the 1200s bulls and bears were used for the gruesome sport of bear-baiting. It was a practice that pitted a bull or a bear against a pack of dogs in a fight to the death. Large crowds would gather and place bets on the outcome.
Soon it was common to reference people by the animals they bet on. If you were feeling bullish, you were literally betting on the bull to win the fight.
But it’s also about how the animals fought. When a bull attacks, it thrusts its horns upward. When a bear attacks it swats downward. So if you’re bullish, you think the market will go up. If you’re bearish, you think the market will go down.
These terms evolved over the past 800 years to become standard market terminology today.
Sometimes you’ll hear traders say things like “the bulls are advancing … they really have momentum going into the close.”
… or “the bears are dominant today. The bulls are getting crushed!”
BTW, all this talk of awful treatment of animals sickens me. I hate animal cruelty. I’m so honored to support hardworking charities caring for endangered animals through my Karmagawa Foundation. It’s a scary time for too many species unless we make serious changes in the way we treat this planet.
We MUST respect our planet, animals, and each other MUCH MORE. Find out how you can help here.
Now let’s look at…
The Definition of Bullish vs. Bearish
In short, bullish action means market or stock prices are on the rise. Bearish action means market or stock prices are on the decline. That’s the closest we’ll get to a true definition.
Beyond that, bullish and bearish are more like concepts.
When you’re bullish you favor an increase in price. If you’re bearish, you want that price to drop.
You don’t have to be one or the other. You can be bearish on the markets but bullish on a sector, for example. There are lots of ways to look at the bulls and the bears, so let’s start with the broader markets.

What Is a Bull Market?

A bull market is an uptrending market. Remember, bulls go up.
So what do traders mean by ‘the market?’ Most refer to the overall market, and the index most referenced is the S&P 500. That’s a weighted average of the 500 largest publicly traded companies listed in the U.S.
It’s easy to spot a bull market — the S&P 500 will trend up and post new highs. Stock prices rise month over month. We saw this in 2017, 2019, and into the beginning of 2020.
Check out the S&P 500 daily candle chart to get an idea of what a strong bull market looks like. This was 2019.
Historically, bull markets tend to last longer and be more powerful than bear markets. Since the dawn of the U.S. stock market, prices trend up over time.
Of course, there are hiccups along the way. Which is the perfect time to address…
What Is a Bear Market?
Bear markets are when the market declines. Overall stock prices fall. Sellers overwhelm buyers.
When the S&P 500 declines by 20% or more from record highs, the market’s in bear-market territory. By that definition, we entered into a bear market in early 2020. The S&P 500 went from over 3,300 to less than 2,300 in just two weeks. That’s a 30% decline.
Let’s look at the S&P 500 chart from the beginning of 2020. You can clearly see a huge drop. This is what a bear market looks like.
Bear markets can get much bigger than 20%. During the Great Recession, the market was down 50%. Half of all value in the market was gone.
Characteristics of Bullish vs. Bearish Markets
During bull markets, we tend to have low unemployment, stable oil prices, a relatively stable global economy, and lots of people spending money.
Companies rake in profits with no reason to stop or slow down anytime soon.
Bear markets are the opposite. They’re marked by high unemployment. Oil prices can spike or collapse quickly. The global economy is less stable, and international tension may be on the rise.
Businesses don’t typically make as much money, and it’s uncertain as to when or if they’ll hit their highs again.
Not every bull or bear market is the same. Every moment in the market is unique. But these are the general characteristics of bull and bear markets.
Bullish vs. Bearish Candlestick Patterns
I’ve made literally thousands of videos that deal with candlestick patterns. There are far too many to get into in this post.
Check out Steve Nison’s “The Candlestick Course” to better understand how the patterns work. I also suggest you read “The Complete Penny Stock Course” written by my student Jamil (I wrote the forward). That book answers so many of the most frequently asked trading questions.
For now, I’ll show you a few basic bullish vs. bearish candlestick patterns. These patterns alone aren’t enough to get me in a trade. Always take the whole story into account and build a case for trading. Never take a single indicator on its own.
New to penny stocks? Access my FREE penny stock guide here. And sign up for my no-cost weekly watchlist here.
(As an Amazon Associate, we earn from qualifying purchases.)
The Bullish Engulfing Pattern
In this pattern, the first candle is on the left and smaller than the second candle. The second candle will completely ‘engulf’ the first candle by both starting lower and finishing higher than the first candle.
Seems simple, right? Again, I like to look at the whole picture. While this can be an indication of the trend reversal, it’s not a guarantee. I always consider several indicators like volume, time of day, and catalysts before I take a trade.
Here’s one more basic candlestick pattern…
The Bearish Engulfing Candle
Just like with the bullish engulfing pattern, the first candle is smaller than the second candle on the right. The second candle will once again engulf the first candle — starting higher and finishing lower than the first.
This is a bearish engulfing candlestick pattern. Study these charts. These patterns repeat. Learn to recognize them in the heat of the moment.
It’s also important to know the limits of a pattern too. A bearish engulfing pattern is not a signal to short a low float on its first green day. Take the whole picture into account before placing a trade.
These are basic patterns, and there’s so much more to study. Follow up by studying the bull flag and breakouts. These are great patterns that can work in any market.
How Can You Trade Bullish vs. Bearish Markets?

Most traders lose money. But my top students and I trade through any market conditions.
How? We study. We’re dedicated and committed to trading smarter. I’ve been trading for over 20 years. I started with about $12,000. I’ve now made over $5 million trading penny stocks. I log more profits than losses every single year.*
Some of my top students like Tim Gritanni have made even more than that.* Everyone wants to know how we do it.
The concept is simple — but the execution is hard.
We recognize the patterns. The markets may change, but the patterns mostly stay the same. My top students and I know how to trade through anything. We learn the patterns that work for our strategies, then adapt them to what works in the market now.
Can you do the same? I think you can. But you have to work for it.
Trading is HARD. What works for one person won’t always work for someone else.
This is not a way to get rich quick. You may not get rich at all for that matter. It’s about learning the process. I teach the process I’ve used for over two decades to help my students shorten their learning curve. Learn from my mistakes.
I love to teach … But you need to be willing to learn. This is a tough game. Over 90% of traders fail. If you want to be different from the 90%, you gotta do something different.
(*Please note: these results are not typical. My students and I spent years developing exceptional skills and knowledge. Always remember trading is risky. 90% of traders lose money. Never risk more than you can afford.)
Trading Challenge
I challenge myself to find the hardest working students and train them to become self-sufficient traders.
I have a strict application process — I won’t accept just anyone. You must be willing to work hard. This is not an easy road, so slackers need not apply.
Ready to take charge of your own life, apply now for my Trading Challenge. Show me you have what it takes.
Bullish and Bearish Indicators
Indicators on charts can show the overall market sentiment.
These lines can indicate a change from bullish to bearish and bearish to bullish.
Some common indicators include the VWAP and moving averages. When the price crosses one of these lines, it shows the stock or the market trend is changing direction. These indicators help show who’s in charge … the buyers, aka the bulls, or the sellers, aka the bears.
When the price falls below the VWAP, that’s bearish. And if the price spikes up through the VWAP that’s bullish.
Full disclosure: I don’t trade using indicators.
Never trade on a single piece of information on its own. Don’t trade based solely on these indicators. Take the entire picture into account.
Trading in Bullish Markets vs. Bearish Markets
The key to trading in any market is to trade with the market and never try to predict. Always react.


I’ve been going long even in the current bear market. I prefer to trade in hot sectors. Right now, the COVID-19 pandemic is wreaking havoc across the international marketplaces. But some stocks could actually benefit…
We’ve seen huge spikes in the food-delivery, face mask, and vaccine stocks.
My trades on Luvu Brands, Inc. (OTCQB: LUVU) and Galaxy Next Geberation, Inc. (OTCQB: GAXY) happened while the rest of the market was crashing. I made more than $1,000* on each of those trades. Meanwhile, the S&P 500 was down 30% in two weeks.
The key is to find what works for you and stick to it. It’s OK to not trade every day. There will be more trades tomorrow and the day after…
How can you survive in any market? Limit your trades to the very best setups for your strategy.
(*Please note: my results are not typical. I’ve spent years developing exceptional skills and knowledge. Always remember trading is risky. Never risk more than you can afford.)
When Does a Market Change From Bearish to Bullish?
A market goes bullish when there aren’t enough sellers to continue to push the prices down.
After a major event like the Great Recession or this year’s coronavirus pandemic, the bears will eventually run out of steam. The selling will slow and the market will turn from bearish to bullish. It’s easy to spot in hindsight, but nearly impossible to see in real time.
There are so many ‘experts’ and ‘gurus’ who try to predict the next market move. Sometimes they get lucky and get it right. But you can out pick most ‘experts’ by flipping a coin.
So don’t spend your time trying to pick the top or pick the bottom. Study specific patterns and learn the patterns that repeat over and over again.
If you’re truly ready to learn a process, apply now for my Trading Challenge.
Conclusion
Markets rise and fall. Bulls push higher and bears will push lower.
The key to making money in the market is to be on the side of the more powerful force. When the bulls have the upper hand, I stay on the long side. When the bears have the upper hand, I watch for a hot sector. Just like with coronavirus stocks and sympathy plays.
At the end of the day, terms like bullish vs. bearish are just another way of saying up or down, buy or sell, long or short. Traders use these terms interchangeably.
Remember, the key to trading in any market — bear or bull — is to react. Never try to predict. Trying to pick the top and the bottom is a great way to go broke.
Is this your first bear market? Leave a comment below and let me know what you think!

Leave a reply