Reading stock charts is a fundamental skill for anyone venturing into investing or trading in the stock market. These charts are not just lines and numbers; they are the pulse of the market, telling stories of stocks, companies, and the broader business world. As a seasoned trader and educator, I’ve seen many beginners overwhelmed by stock charts, but with the right approach, they can be simplified.
Readers should delve into this article because it demystifies the art of reading stock charts, a crucial skill for anyone in the trading and investing realm, offering practical insights and tools to interpret market trends and make informed decisions.
I’ll answer the following questions:
- What are stock charts?
- How do stock charts work?
- How can you read stock charts effectively?
- What is the significance of trendlines in stock charts?
- How do dividends and stock splits affect stock charts?
- Why is understanding historic trading volumes important?
- What are the different types of stock charts and their uses?
- How do fundamental analysis and technical analysis differ in stock market investing?
Let’s get to the content!
Table of Contents
- 1 What Are Stock Charts?
- 2 How Do Stock Charts Work?
- 3 How To Read Stock Charts
- 4 How To Read Different Types of Stock Charts
- 5 Fundamental Analysis vs Technical Analysis
- 6 How To Use Stock Indicators To Understand Stock Charts
- 7 What Are the Common Stock Chart Patterns?
- 8 How Do Investors Use Stock Charts?
- 9 Key Takeaways
- 10 Frequently Asked Questions
What Are Stock Charts?

Stock charts are visual representations of a stock’s price movements over a period of time. They provide critical information on trading volumes, price trends, and stock performance. Each chart offers a unique window into the market’s soul, giving traders and investors a way to analyze how stocks have behaved in different market conditions.
Understanding stock charts is more than just looking at numbers; it’s about interpreting the data to make informed decisions.
How Do Stock Charts Work?
Stock charts work by plotting the price of stocks over a set period. They help traders and investors identify trends, patterns, and potential entry and exit points. The charts display crucial data like opening and closing prices, highs and lows, and trading volumes, offering a comprehensive view of stock performance. Analyzing this information allows traders to gauge market sentiment, understand price movements, and plan their investment strategies.
How To Read Stock Charts
Reading stock charts is a critical skill in trading, akin to understanding the language of the markets. It’s about interpreting the data presented in charts to make informed trading decisions.
When I teach beginners, I emphasize that it’s not just about the numbers and lines but understanding what they represent — from price movements to investor sentiment. A stock chart can tell you more than just the current price of a stock; it can provide insights into the stock’s past performance and potential future behavior.
Learning to read these charts is like developing a new sense, one that can be crucial for successful trading, whether you’re dealing with stocks, finance, or even broader markets like the money market or mortgage rates. It’s a foundational tool that all traders, regardless of their brokerage or strategy, should master.
The number-one tool you’ll need to read stock charts is a good charting platform — when it comes to charting tools, StocksToTrade is first on my list. Its comprehensive tools and data are crucial for effective stock analysis, and its real-time data, research options, and various indicators make it a top choice for traders at all levels.


It’s a powerful day and swing trading platform that integrates with most major brokers. I helped to design it, which means it has all the trading indicators, news sources, and stock screening capabilities that traders like me look for in a platform.
Grab your 14-day StocksToTrade trial today — it’s only $7!
Identify the Trendline

The trendline in a stock chart indicates the general direction in which a stock’s price is moving. It’s essential for understanding the stock’s momentum – whether it’s moving upwards, downwards, or sideways. Identifying the trendline helps in making predictions about future stock movements and deciding when to buy or sell.
It’s not just about recognizing a line on a chart; it’s about deciphering the story behind the price movements. Trend analysis helps traders to identify the direction and strength of market trends, providing insights that are crucial for making informed trading decisions. Whether you’re a beginner or an experienced trader, mastering trend analysis can significantly enhance your market understanding.
For a deeper dive into this essential skill, explore my guide to trend analysis, where you’ll find valuable strategies to interpret market trends effectively.
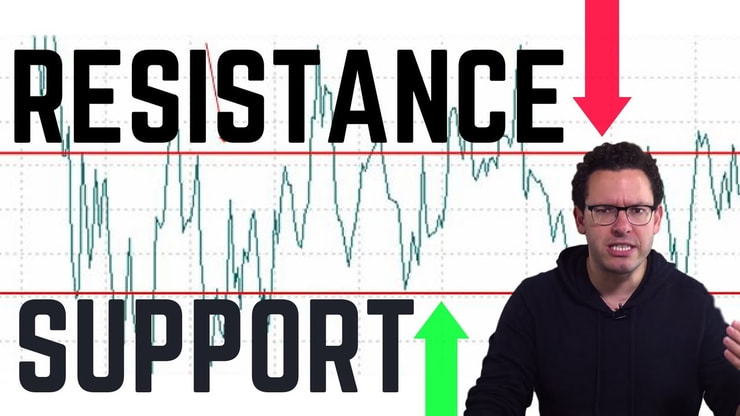
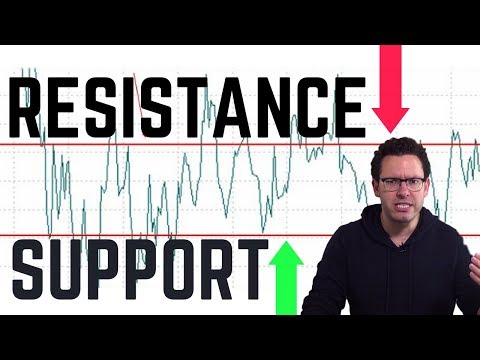
Look for Lines of Support and Resistance
Support and resistance lines on stock charts are critical for predicting price movements. The support line represents a level where the stock price tends to stop falling and bounce back up, indicating strong demand. Conversely, the resistance line is where the price often tops out, suggesting a sell-off point. Understanding these lines can significantly enhance trading decisions.
Know When Dividends and Stock Splits Occur
Dividends and stock splits are represented on stock charts and can significantly impact stock prices. Dividends indicate company profits being returned to shareholders, which can attract more investors. Stock splits, on the other hand, affect the share price and can make a stock more accessible to a broader range of investors. Monitoring these events on charts is crucial for understanding their impact on stock performance.
Understand Historic Trading Volumes
Trading volumes depicted in stock charts show the number of shares traded in a given period. High trading volumes often indicate strong interest in a stock and can precede significant price moves. Analyzing historical trading volumes helps in understanding the strength behind price trends and in making more informed trading decisions.
How To Read Different Types of Stock Charts

Different types of stock charts offer various lenses through which to view market data. In my experience, each chart type – whether it’s a line, bar, or candlestick chart – can unveil unique aspects of market behavior. For instance, while a line chart might provide a clear view of a stock’s overall trend, a candlestick chart can offer deeper insights into market sentiment and potential reversals. Understanding these different chart types is not just beneficial; it’s necessary for developing a well-rounded trading strategy. They serve as crucial tools, much like a financial advisor would use different tools like CDs, loans, or credit cards for varying financial purposes.
Candlestick Charts
Candlestick charts are popular among traders for their detailed representation of price movements — they’re what I use most often. Each ‘candlestick’ shows a stock’s opening, closing, high, and low prices, offering insights into market sentiment. The color and size of the candlesticks can indicate whether a stock is experiencing buying (bullish) or selling (bearish) pressure.
There have been whole books written about candlestick theory.
(As an Amazon Associate, we earn from qualifying purchases.)
Candlestick patterns can reveal a lot about market sentiment and potential price reversals. To enhance your trading skills with these techniques, check out my advanced guide to reading candlesticks.

Bar Charts
Bar charts provide a similar view to candlestick charts, showing the opening, closing, high, and low prices. Each bar represents the stock’s price range within the selected time frame, with a small notch indicating the closing price. Bar charts are useful for identifying price patterns and trends over time.

Line Charts
Line charts are the simplest, showing just the closing prices of stocks over time. They offer a clear view of a stock’s overall trend and are useful for identifying longer-term price movements. While they lack the detail of candlestick or bar charts, line charts are a great starting point for beginners.

Point and Figure Charts
Point and figure charts focus solely on price movements, ignoring time and volume. These charts help in identifying clear price patterns and trends, eliminating the ‘noise’ of less significant price movements. They are particularly useful for setting price targets and stop-loss levels.
Renko Charts
Renko charts are unique in that they change only when the price moves by a predefined amount, focusing on significant price movements. These charts help in filtering out minor fluctuations, making it easier to see real trends and resistances in the market.
Fundamental Analysis vs Technical Analysis
The main difference between fundamental and technical analysis lies in their approach to investing and decision-making. Fundamental analysis focuses on the intrinsic value of a company, considering factors like earnings, market position, and overall economic conditions. It’s about understanding the business behind the stock. Technical analysis, on the other hand, relies heavily on charting and patterns to predict future stock movements. It’s about identifying trends and making predictions based on historical price actions and volumes. In my trading career, I’ve seen that successful investors often combine both approaches, using technical analysis to time their trades and fundamental analysis to choose their investments.
How To Use Stock Indicators To Understand Stock Charts
Stock indicators are essential tools in a trader’s arsenal, used to dissect complex stock charts and glean actionable insights. Throughout my trading career, I’ve relied on indicators like moving averages and Bollinger Bands to make sense of market trends and price movements. These indicators can simplify the complexities of the stock market, making them indispensable for both new and experienced traders. They help in understanding not just the stocks themselves but also broader market dynamics, which can influence things like finance rates and investment strategies.
For anyone serious about trading, mastering these indicators is as crucial as understanding the basics of a mortgage or the terms of a credit card.

Moving Averages
Moving averages smooth out price data to identify trends. They average a stock’s price over a specific period, helping to filter out the noise from short-term fluctuations. The two most common types are the simple moving average (SMA) and the exponential moving average (EMA), each giving different weight to price data.

Bollinger Bands
Bollinger Bands consist of a set of three lines: the central line is a moving average, and the other two are standard deviations away from this average. They help in identifying the volatility of a stock and potential overbought or oversold conditions.

Average Directional Index (ADX)
The ADX measures the strength of a trend, regardless of its direction. A high ADX value typically indicates a strong trend, while a low value might suggest a weak or non-existent trend. This indicator is valuable for determining whether a trend is worth following.
Relative Strength Index
The Relative Strength Index (RSI) is a momentum oscillator that measures the speed and change of price movements. It ranges from 0 to 100 and is typically used to identify overbought or oversold conditions in a stock.
On-Balance Volume (OBV)
On-Balance Volume (OBV) is a cumulative indicator that adds volume on up days and subtracts on down days, aiming to measure the flow of volume in relation to a stock’s price movement. It’s used to predict price changes based on volume flows.
What Are the Common Stock Chart Patterns?
Recognizing common stock chart patterns is vital for predicting future market movements. In my years of trading and teaching, I’ve observed how patterns like head and shoulders or cup and handle can signal significant shifts in market trends. Understanding these patterns allows traders to anticipate potential price movements, informing decisions on when to buy or sell. It’s similar to how a savvy investor keeps an eye on mortgage rates or news content to make informed decisions.
Chart patterns are not just lines on a graph; they are reflections of market psychology, supply and demand, and can be as telling as a company’s earnings report or a country’s financial news.
Continuation Patterns
Continuation patterns, such as triangles, flags, and pennants, indicate that an existing trend is likely to continue after a brief pause. These patterns are key for traders looking to capitalize on the resumption of a trend.
For traders aiming to refine their skills in identifying and leveraging these patterns, my in-depth guide on continuation patterns offers invaluable insights and strategies for predicting market trajectories.
Reversal Patterns
Reversal patterns signal a potential change in the direction of a trend. Head and shoulders, double tops, and bottoms are some common reversal patterns. Identifying these can be crucial for traders to anticipate market turns and adjust their strategies accordingly.
How Do Investors Use Stock Charts?

Investors use stock charts as a tool to analyze and predict future stock movements. By identifying trends, patterns, and volume changes, investors can make more informed decisions about when to buy or sell a stock. Stock charts also help in risk management, allowing investors to set more precise stop-loss orders and take-profit points.
In my experience, whether for short-term trading or long-term investing, the ability to read and interpret stock charts is a fundamental skill that can significantly influence investment outcomes.
Key Takeaways
- Understanding how to read stock charts is essential for successful trading and investing.
- Different types of stock charts provide various insights into market behaviors and trends.
- Combining fundamental and technical analysis can lead to more informed investment decisions.
- Learning to use stock indicators effectively can enhance the understanding of stock charts and market movements.
- Recognizing common stock chart patterns helps in predicting future price actions and planning trades accordingly.
Trading isn’t rocket science. It’s a skill you build and work on like any other. Trading has changed my life, and I think this way of life should be open to more people…
I’ve built my Trading Challenge to pass on the things I had to learn for myself. It’s the kind of community that I wish I had when I was starting out.
We don’t accept everyone. If you’re up for the challenge — I want to hear from you.
Apply to the Trading Challenge here.
Trading is a battlefield. The more knowledge you have, the better prepared you’ll be.
How do you use charts in your trading strategy? Let me know in the comments — I love hearing from my readers!
Frequently Asked Questions
How Many Types of Chart Patterns Are There?
There are numerous chart patterns in technical analysis, but they are generally classified into two main categories: continuation and reversal patterns. Each category encompasses a variety of specific patterns, each with its own predictive value.
What Is the Strongest Chart Pattern?
The ‘strongest’ chart pattern can vary depending on market conditions and the context in which it appears. However, patterns like the head and shoulders, double top/bottom, and bull/bear flags are widely regarded as reliable indicators of future price movements.
What Do Chart Patterns Mean?
Chart patterns are formations within stock charts that indicate potential future price movements. They are formed by the fluctuations in stock prices and can signal continuation or reversal of trends, helping traders and investors make predictions about future market behavior.
How Can Brokers Help You Understand Stock Chart Results?
Brokers often provide educational resources that include examples of stock chart analysis. These examples can demonstrate how to interpret results and trends in the stock market effectively. For beginners, understanding these examples is key to making informed decisions based on stock chart data. Moreover, brokers can offer personalized advice or tools for better analysis, which can be particularly beneficial when comparing your analysis with others in the trading community.
How Can Understanding HELOCs Influence Investment Decisions in Stock Market?
While a HELOC (Home Equity Line of Credit) is primarily associated with property financing, understanding its implications can also influence investment decisions in the stock market. For instance, homeowners might consider using funds from a HELOC to invest in stocks. However, it’s crucial to analyze stock charts and market trends carefully before making such decisions, as the risk profile of stock investments differs significantly from that of a secure loan like a HELOC. Properly interpreting stock charts can help in assessing whether the potential returns in the stock market justify the risks of leveraging a house’s equity for such investments.

Leave a reply