High volume penny stocks are my favorite stocks to trade. I like volatile stocks. If there’s no volume, there’s no trade.
Why’s volume so important? High volume stocks have the biggest potential for big moves.
But there’s more to it than that. High volume doesn’t always mean a stock price will go up. A stock can go down with high volume if there are a lot of sellers…

Before you take a trade, you have to put all the indicators together.
In this post, I’ll go over what a high volume stock means, why it’s so important, and I’ll share some high volume penny stocks with charts. Read on…
Table of Contents
- 1 What Are High Volume Stocks?
- 2 How to Find High Volume Stocks in 3 Steps
- 2.1 #1) Look for the high volume penny stocks that have gone up the most since yesterday’s closing price.
- 2.2 #2) Look at social media.
- 2.3 #3) Use a software platform with killer scanning tools.
- 2.4 Technical and Fundamental Analysis
- 2.5 Analysis Software
- 2.6 Stick to Your Indicators and Favorite Patterns
- 2.7 Bonus Tip: Knowledge Supports Growth
- 3 Does High Volume Mean a Trade Is a Good Idea?
- 4 How Important Is Stock Volume for Penny Stock Traders?
- 5 How You Can Use High Volume Stocks to Improve Your Trading Strategies
- 6 Penny Stocks With High Average Daily Trading Volume
- 7 Apply for My Millionaire Challenge
- 8 Frequently Asked Questions About High Volume Stocks
- 9 The Bottom Line
What Are High Volume Stocks?
High volume stocks are those with a large number of shares traded over a certain period of time. Stock trading volume depends on the type of stock. On its slowest day, Apple Inc. (NASDAQ: AAPL) will trade a lot more than any penny stock.
But that doesn’t make Apple a better stock to trade than penny stocks — not at all.
Lots of penny stock traders think high volume stocks are automatically good and low volume stocks are automatically bad. It’s not that simple. You have to look at the total situation.
If a stock’s volume is high because a surge in buying or selling is making the price move, that’s worth looking at. You want prices to move. Volatility can potentially mean profit!
But if a stock’s volume is high just because it’s always high, then who cares? Let the high-frequency traders make their profits with Apple. You can’t compete with them.
How Can You Determine a Stock’s Volume?
All stock charts show trading volume as well as price.
For each day, look at the bottom, below the graph displaying the price history. You’ll see a vertical bar. The scale of the bar chart is on the right. You’ll see an example of volume bars in some chart examples I share later…
You’ll see at a glance just from looking at the height of the daily bars whether the volume is trending up or down. Most of the time with penny stocks, it just bounces around randomly. Most charting tools allow you to set a moving average for volume. This will help you easily spot volume anomalies.
If you spot a sudden surge in volume after a period of low volume trading, that could indicate either a pump or some kind of unusually good or bad news for this stock. And that could represent a trading opportunity.
Stock Volume vs. Dollar Volume
You can measure volume using the number of shares or by the dollars transacted. The number of shares is the exact number of shares bought and sold that day. But you also want to look at the dollar volume involved, because every stock trades at a different price.
To find the dollar volume, simply multiply the number of shares bought and sold by the average price. Boom. Done.
For instance, if I tell you a company’s trading volume yesterday was 10 million shares, you might think that sounds like a high volume. However, if the stock shares average only a penny per share, that’s only $100,000 in dollar volume, which is really small.
If a company’s stock is worth $10, and traders bought and sold one million shares, its trading volume is $10 million. That’s a lot larger than the first example.
More Breaking News
- Red Cat Holdings Poised for Growth as Drone Orders Surge
- Vizsla Silver Shows Resilience Amid Unsteady Market
- Entegris Faces CFO Transition Amid Price Target Boosts from Analysts
- Datadog Battles Price Target Reductions Amid Growth Hopes
Why Does Volume Matter?
When you trade a stock, you want to get in and out quickly, without affecting the price. That’s an argument for trading high volume stocks. With low volume stocks, you have to wait to be filled — and your order jacks up the price.
When you need to get out, you want to sell fast. You don’t want your order to signal other traders it’s time to raise their prices.
Changes in trading volume also tell you something’s going on and indicate the stock price is moving. Traders don’t buy and sell in large volumes without the stock’s market price surging or dropping, depending on whether fear or greed is dominant.
When a stock’s volume surges from one million to 10 million shares, that may indicate a situation you can take advantage of.
However … maintain your trading discipline. Look for the trading patterns and chart formations that work. Looking at a stock’s volume is just one factor you should check out when you do your research.
Benefits of Trading High Volume Stocks
Volatility
When a stock is trading with high volume, it means a lot of people are interested in the company. Many people are taking positions, seeking to buy or sell at a profit. Money is flowing fast and furious.
The more money flowing into the markets around a particular company, the more likely the stock is to make a large price move — up, down, or both. Volatility is your friend.
- When you’re on the right side of a trade, large price moves can mean the potential for more profit.
- When you’re on the wrong side, you can lose more money than usual. That’s why rule #1 is to cut losses quickly!
Liquidity
Stocks with high volume are more liquid. That means it’s easier and faster to get your orders filled. You can buy or sell more shares of a stock without your own orders pushing the stock’s price higher or lower.
And when you’re ready to close out the trade, high volume and liquidity make it easier to buy or sell without your closing order pushing the market against you.
High volume with a fast-moving share price can indicate news or a catalyst is at play. Look for earnings announcements, contracts with large companies, product launches, and press releases.
I go over chart patterns, catalysts, earnings, and contract winners in my most comprehensive DVD, “How to Make Millions.” It’s 35 hours of in-depth education. All proceeds from the purchase go to charity — it’s a win-win!
Volume is just one stock trading indicator. Look at the big picture. Do your research and stock analysis. Look for other indicators of a good trade.
If the high trading volume indicates a stock is breaking out or going through a trendline, consider making your play.
Maintain your discipline. Manage your risk. Don’t let one indicator fake you out!
I go over the indicators I consider before every trade in my Sykes Sliding Scale. Learn more about it in my “Trader Checklist Part Deux” DVD. Some of my indicators have nothing to do with the stock or the chart. Think bigger picture!
How to Find High Volume Stocks in 3 Steps

Here’s an efficient, three-step plan you can use when you’re hunting for high volume stocks…
#1) Look for the high volume penny stocks that have gone up the most since yesterday’s closing price.
Price movement is more important than trading volume. And stocks that have surged in one day have almost certainly had a corresponding rise in trading volume. If they don’t, you may want to avoid them.
Stocks that are up big should have high volume pushing the stock higher. If a stock is up 5% on below-average volume, it could be a trap set by the market makers to get rookie traders into bad positions.
Remember that volume validates the price movement. A large increase in a stock price MUST be accompanied by an equally large increase in volume.
Yes, seriously. I’m looking for companies that are being hyped. But never believe people on social media or in chat rooms. Always do your own research.
Go in with your eyes wide open and your hand holding tight to your wallet. If somebody’s pushing a small stock higher, maybe you can hitch a ride — just don’t believe you’ve found the next Apple.

#3) Use a software platform with killer scanning tools.
I use StocksToTrade every day. I’ll tell you why in a bit when we get more into detail on software.
The good thing is, there are plenty of penny stocks with high trading volumes. You need to analyze the opportunities so you find those worth trading. The right software can help you find them.
Technical and Fundamental Analysis
Fundamental analysis is the process of researching a stock based on the fundamental value of the company.
You look at things like what sector the company’s in, whether it’s one of the sector’s leaders or laggards, whether it’s making or losing money, and a hundred other factors.
Technical analysis means studying the stock’s chart indicators. The most important is obviously its current market price. And the chart shows you the past price moves. You can see at a glance whether it’s been going up or down or floating sideways.
A stock’s past price movements can create recognizable patterns. These indicate the collective emotions of the market toward the stock and how traders have been buying and selling it in reaction.
Those patterns tell a story about the stock’s past and can help predict its future. The price action normally forms a trendline that’s headed either up or down. If a stock breaks through a trendline, that’s significant.
Looking at a chart is essential for determining whether the stock’s trading volume is high. And it contains lots more information.
Markets are a form of crowdsourcing, and technical analysis is how you read what the masses of other traders and investors are saying about a stock and its future.
Analysis Software
Researching, studying, and analyzing stocks involves crunching a lot of numbers, and computers are a lot better at that than people.
While software can bring up company information and news, you’re ultimately responsible for deciding whether that makes a company a good opportunity.
Yes, software can draw trendlines and calculate moving averages, but YOU have to determine what the indicators say about the potential trade.
Ask yourself:
- Is this stock a good trading opportunity for you?
- What do all the patterns and numbers actually mean?
- Is volume where you want it, or is it a possible fake-out?
I’ve used many trading platforms over the years, but couldn’t find one that had everything I needed to carry out my trading as quickly and as conveniently as I wanted to…
… So I stepped up and did it myself (along with an incredible team).
StocksToTrade
StocksToTrade is the trading platform that — finally — does everything I ever need.
You don’t need to visit 10 or 15 websites to keep up with all the most in-play stocks!
With StocksToTrade you get charting, news feeds, quotes, watchlists, and more, all within a user-friendly piece of software.
It gives me all the information I use in my own trading — and does it quickly and easily.
Get the new Breaking News Chat add-on feature to get fast alerts on breaking news that’s relevant to penny stocks! It was a game-changer for me in the insane 2020 volatility.
Check out both the platform and Breaking News Chat with a 14-day trial for $17.
(Full disclosure: I helped develop StocksToTrade and I’m a major investor.)
Stick to Your Indicators and Favorite Patterns
There must be a hundred or more trading patterns and indicators. Maybe a thousand.
Do you have to learn and master all of them to potentially make money trading penny stocks?
Nope!
You need to know how to read a chart. You need to know the basics of trends and trendlines, volume, and moving averages.
Learn the patterns and indicators that work well for you and stick with them. When you trade, focus on what works for you.
Bonus Tip: Knowledge Supports Growth
You should never stop learning. Markets change. Economies change.
The day you believe you know it all, that’s when somebody will figure out how to eat your lunch … and your breakfast, dinner, and midnight snack. Don’t let this happen to you! Always be ready to keep learning and adapting.
Does High Volume Mean a Trade Is a Good Idea?

High trading volume is one factor to consider when you’re making a trade — but it’s not remotely the only factor.
Look at the big picture. Has there been some important news about the company? Sometimes, this makes a huge difference.
If a stock’s trading volume is high just because it’s always high, but the price isn’t trending or breaking out, forget it.
High volume is good for confirming breakouts are real and the price can continue to surge.
Look for your indicators and chart patterns, then see if a high volume confirms the breakout!
Becoming More Confident About Trading High Volume Stocks
As you’ve learned, a stock with a high volume of trades is a good thing, but that alone isn’t a sign of a sure thing. That’s a common beginner’s mistake.
As you study and practice trading, you’ll become more confident about trading stocks.
You’ll get more adept at spotting breakouts and the chart patterns that tell you when a stock is about to smash through a point of resistance.
Higher-than-normal volume can also tell you when a signal is valid. It means a lot of other traders are getting in on the action because they want a piece of it.
What About Low Volume Stocks?
A stock with volume of 500,000 to one million shares is fine to trade, up to a few thousand shares. Just make sure you stay on top of it so you can get out fast if the price starts to move against you.
If there’s big news about a stock with a low volume, that’s a red flag. It could mean someone’s trying to run a pump on it. Stay alert!
Always Avoid Stocks That Are too Illiquid for Any Trade
Illiquidity is the main problem with low volume stocks. When you buy, your own order raises the price you pay.
When you want to sell, nobody wants to take your order. You can lose a bundle just trying to run for the exit.
Stay away from all stocks trading at 50,000 or fewer shares a day, period.
How Important Is Stock Volume for Penny Stock Traders?
If you can’t tell by now, volume’s pretty important when considering which stock to trade.
It’s one of the first things I look at when considering which stock to trade. You can have a stock about to break out with a perfect chart, and a catalyst … but if there’s no volume, there’s no play. It means nobody else cares.
Without the volume and demand, it’s gonna be harder for the stock price to climb higher.
And that’s ultimately what we’re looking for out of a trade — to take advantage of a quick upward price movement.
How You Can Use High Volume Stocks to Improve Your Trading Strategies
If you stick to trading the highest average volume stocks, you can avoid a lot of unnecessary trading mistakes.
You don’t have to trade every day. I don’t.
I only trade the highest odds setups, and they don’t come around every day. All the indicators have to come together to indicate a trade. No volume means no trade. That’s why I like to think of myself as a retired trader. And I only come out of retirement for the best setups.
Penny Stocks With High Average Daily Trading Volume

Obviously, large-cap stocks have higher average trading volume than penny stocks. But when the right news is released by a penny stock company, it can bring in huge amounts of volume.
Look at some examples of how volume can create big moves in penny stocks…
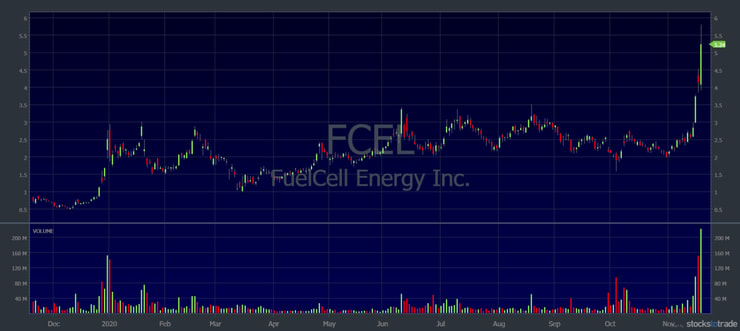
FuelCell Energy, Inc. (NASDAQ: FCEL)
FCEL was trading in a channel between around $2 and $3.50 for months. When the alternative energy sector got hot and electric vehicles (EV) and solar plays were running, FCEL released some news.
It brought in huge volume and the stock broke above resistance and had a big move.

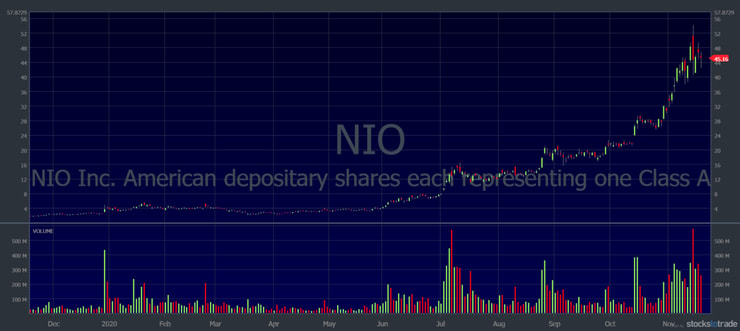
NIO Limited (NYSE: NIO)
Although this stock is now trading in the $40s and it’s far from penny stock status … only a few months ago it was at $3.
This is what huge volume and a hot sector can do to a stock. It’s been one of the most active stocks on the NYSE in 2020. Look at the volume bars on the chart. NIO had multiple days where it traded more than half a billion shares. Even its lowest volume trading days were 30 million to 50 million shares.

Apply for My Millionaire Challenge
Back when I started my trading career, I didn’t have any resources to learn from or mentors to help guide me. It was ROUGH. I made a ton of mistakes and lost a bunch of money.
I started my Trading Challenge to give traders what I didn’t have. The Challenge is where I try to help students avoid the early mistakes that can completely destroy their trading accounts.
Through the Trading Challenge, you can get access to all my resources, trades, commentaries, video lessons, webinars, and more. Plus, you’ll get the chance to learn from my top students.
If you’re serious about learning to make smart trades for yourself, I invite you to apply for the Challenge today.
Frequently Asked Questions About High Volume Stocks

Is It Good for a Stock to Have High Volume?
Definitely! For the type of trading I do, I want high volume and preferably a catalyst along with other key indicators. The catalyst gives a reason for the volume. That can add conviction to a trade. A stock trading its average daily volume doesn’t interest me.
What Happens When a Stock’s Volume Increases?
When a stock has high volume, it means there are more traders and investors buying and selling the stock. If there’s more demand, it means higher prices. If there’s more selling, it means a decline in prices.
What’s a Good Average Volume in Stocks?
I don’t really care what a stock's average volume is. I don’t trade stocks on average days. What I want to see is higher than average volume in a stock, so it has the potential to make a big move. That way I can get in and out and take advantage of a quick price move.
Which Stock Has the Highest Volume?
The stock trading the highest volume will change from day to day. Even a stock with the highest average volume can change as new hot stocks and sectors come and go. I’m always looking for the next opportunity. My strategy isn’t about trading the same stock over and over.
The Bottom Line

Congrats — you made it to the end of the lesson! Now I’ll wrap this all up in a nice, tidy package for you…
- Avoid all stocks that have low liquidity.
- Don’t trade high volume stocks just because they have high volume. Look for chart patterns and other indicators that signal a good trade setup.
- Volume should go up when a stock’s price makes large moves in a day. Use high volume as a way of confirming the price action. It supports the breakout from the trendline or resistance level.
- If a stock’s price jumps or falls a lot without a corresponding surge in trading volume, that’s a red flag.
- A spike in trading volume should also accompany news like an earnings surprise or product launch.
- You can find stocks to trade by looking for those with large percentage increases in trading volume. That could indicate a major surge in demand for the stock, and, therefore, a large movement in price. Happy hunting!
How have you used volume in your technical analysis? What have you learned by trading based on volume analysis? I want to hear about it — share your comments!


Leave a reply