timothy sykes logo

Patterns To Watch

How To Buy Penny Stock Breakouts

Timothy SykesAvatar
Written by Timothy Sykes
Updated 1/3/2023 6 min read

Definitely watch these 20 video lesson on how to spot and buy breakouts and read this great guest blog post from a new trading challenge student below:

Price breakouts are great for people who happened to be in the stock early and think it is due for a breakout. However, for a more active trader the breakout is the sign to buy the stock. The gains might be less overall, but it requires less upfront risk. A stock already moving presents a great opportunity. Obviously, you need to be a trader that knows what to do, but it can avoid the risk of a false signal if you buy before the breakout.

RSI Extremes

The Relative Strength Index (RSI) has a chart with a top and a bottom range that is labeled overbought and oversold, respectively. The top range starts at 70 and the bottom range is 30 and below. The oversold and overbought labels are a bit misleading, because going from the “normal” middle band to one of the extremes means that the price could break out in that direction. It could be a false break over the range lines, but it could also signal rapid movement of the price in the direction of the RSI.

This is where the common explanations of the RSI indicators fail. Overbought and oversold are not accurate descriptions for the ranges. If the RSI continues posting higher numbers as it crosses the 70 or lower crossing the 30, then the existing trend could move rapidly for one last move. The trend can even be sustainable if the RSI cools off while the price stays flat.

On the other hand false signals can telegraph a reversal in the trend. If the RSI goes above 70 then goes lower and even breaks below the 70 line, then it is a strong sign that the uptrend is over and larger downtrend is in the works. This could just be the stock cooling off and consolidating its gains or it could be an overall change in the long-term direction of the stock.

MACD Crosses

The MACD chart has two lines, a slow and fast one, and a histogram. When the fast line crosses the slow line it can be a sign of a change in the prevailing trend. It depends on the general force of the trend whether you would call it a breakout. Fast and steep price action is usually what it takes for it to count as a breakout.

The MACD is a good indicator, but should usually be coupled with others like the RSI in order to give the clearest signals. False signals are very common and not all MACD crosses are breakouts. The MACD is a good measure of momentum, not primarily the trend, so using more directional indicators can create a powerful combination.

One of the things to look out for is for an MACD divergence, which is what occurs when the price moves one way but the MACD moves another such as a price high but the MACD makes a lower high. That indicates that the trend may be near its end. You can use divergences to spot false signals even if the histogram makes a cross. It is not impossible to have it peak across the center line only to head back. That indicates fidelity to the larger trend that is at play with the recent movement in the opposite direction a small correction as opposed to a full reversal.

Highs and Lows

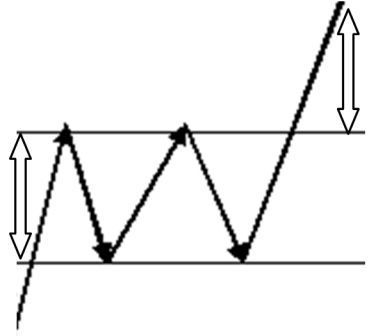
Breakouts also occur when a stock enters completely new territory or at least a price range that it has not been in a while. This is not on a scale of weeks but years. Three years, five years, and maybe even ten years are valid chart ranges. A horizontal line is drawn from either the highest close or the highest point on the chart. You can use either the absolute high or the highest close, or open.

On a candlestick chart you can be sure that a close or open for a bar will be firmer than the tip of the wick. The reason is that the wicks can just be outliers that do not have a ton of volume behind them. Since the candles on this scale would be daily candles you do need to account for outliers.

The horizontal line that is drawn is the line that the price needs to break to see a breakout. There would not really be any meaningful resistance beyond that line. As long as there is momentum the stock could keep rising. There would be no brick wall of investors who want to sell their shares.

Obviously there will always be people locking their gains in, but these will be at specific price levels not chart levels. The psychological resistances of 10s or 100s become more important. There is no line on the chart that could reasonably be looked at by investors or traders. Everything at that point is subjective. This situation also arises for all-time highs, because stocks generally start low, though there are times when a stock has never gone below a certain level since its gone public.

It is acceptable to only focus on the last few years and not the largest timescale. The principles still stand, though for stocks that tend to be popular as current or former long-term holds can have investors ready to exit at various price levels as the stock retreads price levels it has not seen in a long time.

Conclusion

Breakouts are fantastic to trade before they occur, but there are many false breakouts. Trading a breakout as soon as it happens cuts your returns, but gives a quicker trade. The problem with aiming for a breakout is that you can get bogged down in a stock if it is choppy for a bit longer than you expected. You might be right eventually, but it could take a while.


How much has this post helped you?


Leave a reply


Author card Timothy Sykes picture

Timothy Sykes

Tim Sykes is a penny stock trader and teacher who became a self-made millionaire by the age of 22 by trading $12,415 of bar mitzvah money. After becoming disenchanted with the hedge fund world, he established the Tim Sykes Trading Challenge to teach aspiring traders how to follow his trading strategies. He’s been featured in a variety of media outlets including CNN, Larry King, Steve Harvey, Forbes, Men’s Journal, and more. He’s also an active philanthropist and environmental activist, a co-founder of Karmagawa, and has donated millions of dollars to charity. Read More

Post image

Get my weekly watchlist, free

Sign up to jump start your trading education!

* Results are not typical and will vary from person to person. Making money trading stocks takes time, dedication, and hard work. There are inherent risks involved with investing in the stock market, including the loss of your investment. Past performance in the market is not indicative of future results. Any investment is at your own risk. See Terms of Service here

The available research on day trading suggests that most active traders lose money. Fees and overtrading are major contributors to these losses.

A 2000 study called “Trading is Hazardous to Your Wealth: The Common Stock Investment Performance of Individual Investors” evaluated 66,465 U.S. households that held stocks from 1991 to 1996. The households that traded most averaged an 11.4% annual return during a period where the overall market gained 17.9%. These lower returns were attributed to overconfidence.

A 2014 paper (revised 2019) titled “Learning Fast or Slow?” analyzed the complete transaction history of the Taiwan Stock Exchange between 1992 and 2006. It looked at the ongoing performance of day traders in this sample, and found that 97% of day traders can expect to lose money from trading, and more than 90% of all day trading volume can be traced to investors who predictably lose money. Additionally, it tied the behavior of gamblers and drivers who get more speeding tickets to overtrading, and cited studies showing that legalized gambling has an inverse effect on trading volume.

A 2019 research study (revised 2020) called “Day Trading for a Living?” observed 19,646 Brazilian futures contract traders who started day trading from 2013 to 2015, and recorded two years of their trading activity. The study authors found that 97% of traders with more than 300 days actively trading lost money, and only 1.1% earned more than the Brazilian minimum wage ($16 USD per day). They hypothesized that the greater returns shown in previous studies did not differentiate between frequent day traders and those who traded rarely, and that more frequent trading activity decreases the chance of profitability.

These studies show the wide variance of the available data on day trading profitability. One thing that seems clear from the research is that most day traders lose money .

Millionaire Media 66 W Flagler St. Ste. 900 Miami, FL 33130 United States (888) 878-3621 This is for information purposes only as Millionaire Media LLC nor Timothy Sykes is registered as a securities broker-dealer or an investment adviser. No information herein is intended as securities brokerage, investment, tax, accounting or legal advice, as an offer or solicitation of an offer to sell or buy, or as an endorsement, recommendation or sponsorship of any company, security or fund. Millionaire Media LLC and Timothy Sykes cannot and does not assess, verify or guarantee the adequacy, accuracy or completeness of any information, the suitability or profitability of any particular investment, or the potential value of any investment or informational source. The reader bears responsibility for his/her own investment research and decisions, should seek the advice of a qualified securities professional before making any investment, and investigate and fully understand any and all risks before investing. Millionaire Media LLC and Timothy Sykes in no way warrants the solvency, financial condition, or investment advisability of any of the securities mentioned in communications or websites. In addition, Millionaire Media LLC and Timothy Sykes accepts no liability whatsoever for any direct or consequential loss arising from any use of this information. This information is not intended to be used as the sole basis of any investment decision, nor should it be construed as advice designed to meet the investment needs of any particular investor. Past performance is not necessarily indicative of future returns.

Citations for Disclaimer

Barber, Brad M. and Odean, Terrance, Trading is Hazardous to Your Wealth: The Common Stock Investment Performance of Individual Investors. Available at SSRN: “Day Trading for a Living?”

Barber, Brad M. and Lee, Yi-Tsung and Liu, Yu-Jane and Odean, Terrance and Zhang, Ke, Learning Fast or Slow? (May 28, 2019). Forthcoming: Review of Asset Pricing Studies, Available at SSRN: “https://ssrn.com/abstract=2535636”

Chague, Fernando and De-Losso, Rodrigo and Giovannetti, Bruno, Day Trading for a Living? (June 11, 2020). Available at SSRN: “https://ssrn.com/abstract=3423101”