

ICON plc stocks have been trading up by 16.39 percent amid bullish sentiment driven by its strongest clinical research pipeline developments.
Key Takeaways
- Q3 2026 for ICLR showed year-on-year EPS and revenue declines, but adjusted EPS of $2.66 and revenue of $2.02B still topped consensus estimates.
- Management raised 2026 revenue guidance to $8.10B–$8.20B and tightened EPS guidance to $10.35–$10.65, bracketing and slightly above Street expectations.
- Very strong bookings, record backlog, robust free cash flow, and $400M in buybacks signal ICON plc’s confidence despite softer current trends.
- Bank of America upgraded Icon plc to Neutral with a higher $185 target, while RBC reiterated Outperform on ICLR, citing strong backlog and industry‑leading book‑to‑bill.
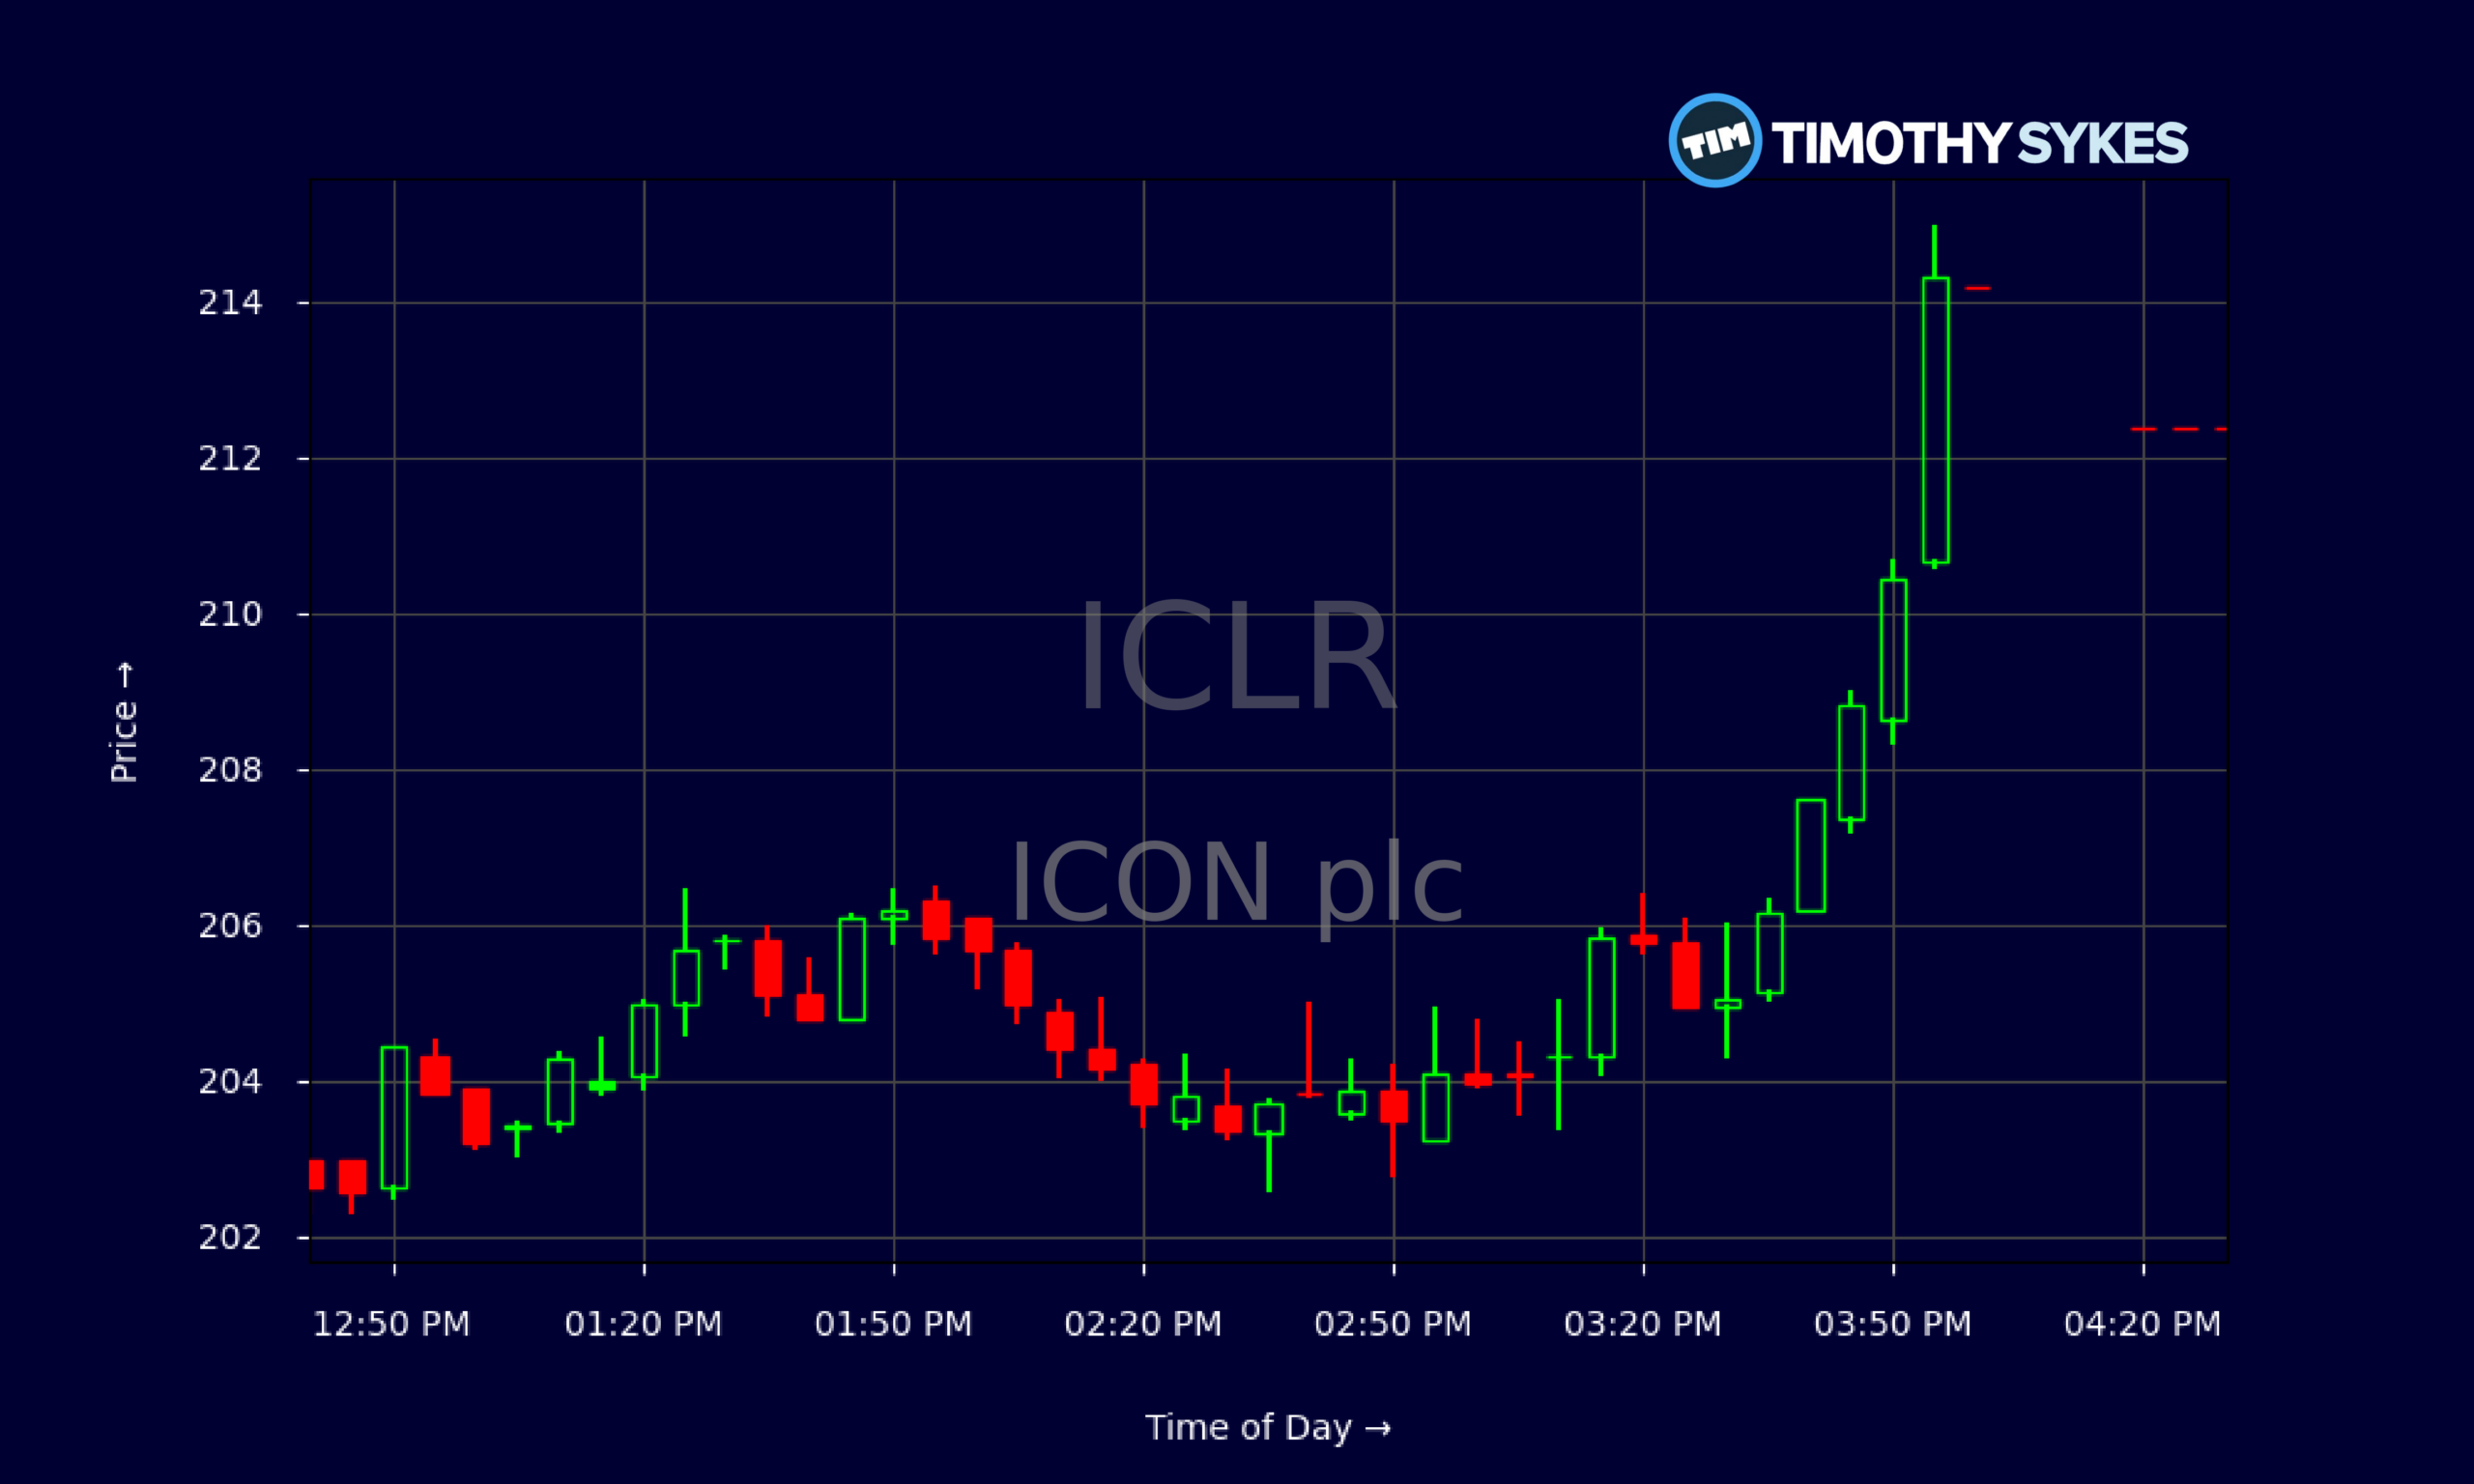
Live Update At 16:47:23 EDT: On Wednesday, October 28, 2026 ICON plc stock [NASDAQ: ICLR] is trending up by 16.39%! Discover the key drivers behind this movement as well as our expert analysis in the detailed breakdown below.
Quick Financial Overview
The tape tells you right away that traders liked ICON plc’s latest update. ICLR closed at $214.16 on 2026/10/28, exploding off the prior day’s $182.98 close. That’s roughly a 17% two‑day move from the 10/26 close around $183.78 — serious momentum for a large‑cap CRO.
Zooming out, ICLR has ripped from the mid‑$160s in early October to above $210 after earnings. That stair‑step pattern — higher lows from $161.69 on 2026/10/06 up through $185–$190 before the gap — shows steady dip buying ahead of the report. Earnings acted as the catalyst.
Intraday, the 2026/10/28 5‑minute chart shows a strong open near $199, a fast push over $205 by mid‑morning, and an afternoon grind to $214.94 before a close near the highs. That’s classic trend‑day action, with ICLR holding gains instead of fading.
More Breaking News
Fundamentals back the move. ICON plc runs at a price‑to‑sales of about 1.52 and a P/E near 56.6, rich but not crazy for a contract research leader with $8.25B in annual revenue and improving guidance. Leverage looks manageable with long‑term debt of about $2.87B against total assets of roughly $16.27B, and equity around $9.19B. For active traders, that combo of technical strength and solid balance sheet keeps ICLR firmly on the watchlist.
Why Traders Are Watching ICLR After Q3
Earnings season is where stories reset, and ICON plc just rewrote its script. ICLR’s Q3 2026 numbers were not pretty on a year‑over‑year basis — non‑GAAP EPS and revenue both declined versus last year. But the market cares about expectations, and ICON beat them. Adjusted EPS came in at $2.66 versus $2.62 expected, with revenue at $2.02B versus $2.01B. Slight beats, but enough to spark roughly a 4.4% after‑hours pop and follow‑through on the next session.
Under the hood, the story gets better. Management for ICLR highlighted very strong bookings, a record backlog, and robust free cash flow. They also pushed through $400M of share repurchases in Q3. That’s a clear tell: ICON plc is confident enough in its pipeline and balance sheet to aggressively shrink the float.
Guidance is the real headline for traders. ICLR raised 2026 revenue guidance to $8.10B–$8.20B, above the $8.14B consensus midpoint, and tightened adjusted EPS guidance to $10.35–$10.65, bracketing and slightly topping the Street at the high end. When a company with year‑on‑year declines still leans bullish on the future, shorts have to respect that.
Wall Street is recalibrating around ICLR too. Bank of America upgraded Icon plc to Neutral from Underperform and hiked its target to $185, pointing to a healthier CRO demand backdrop and stronger direct‑fee bookings. RBC kept an Outperform on ICLR, citing an industry‑leading book‑to‑bill ratio and backlog that support at least mid‑single‑digit growth into 2027. UBS is more cautious, holding a Neutral stance and warning about client‑specific issues that may cap margins and bookings, even as the broader analyst crowd still sits at an Overweight‑type consensus around $188.75.
For traders, that blend of raised guidance, improving sentiment, and still‑mixed coverage creates fuel for both breakouts and sharp pullbacks — perfect for short‑term setups.
Conclusion
ICON plc just delivered the kind of “good enough plus” quarter that often drives trend shifts. ICLR posted year‑on‑year pressure on revenue and EPS, but still topped expectations, raised 2026 revenue guidance, and tightened EPS targets above consensus. Layer on very strong bookings, a record backlog, and $400M in buybacks, and you get a clear message: management sees the current softness as temporary, not structural.
The chart confirms that view. ICLR has broken out from the mid‑$160s base into the $210s on heavy post‑earnings momentum. As long as price holds above the earnings gap zone in the high $180s to low $190s, bulls remain in control. A failed hold there would tell a different story and give reactive traders a reason to bail or flip.
Analyst takes on ICLR are constructive but not euphoric, which actually helps. Bank of America’s upgrade and RBC’s Outperform nod to ICON plc’s backlog strength, while UBS’s Neutral rating keeps traders honest about margin and client risk. That tension often creates cleaner intraday moves as headlines and guidance updates hit.
For active traders, the key now is discipline. As Tim Sykes likes to say, “the market doesn’t care about your opinion, only your preparation and your risk management.” As millionaire penny stock trader and teacher Tim Sykes, says, “Preparation plus patience leads to big profits.”. ICLR has the volatility, story, and liquidity to reward that preparation — but only for those who treat this purely as trading and always, always cut losses fast. This coverage is for educational and research purposes only, not a recommendation to buy or sell any security.
This is stock news, not investment advice. Timothy Sykes News delivers real-time stock market news focused on key catalysts driving short-term price movements. Our content is tailored for active traders and investors seeking to capitalize on rapid price fluctuations, particularly in volatile sectors like penny stocks. Readers come to us for detailed coverage on earnings reports, mergers, FDA approvals, new contracts, and unusual trading volumes that can trigger significant short-term price action. Some users utilize our news to explain sudden stock movements, while others rely on it for diligent research into potential investment opportunities.
Dive deeper into the world of trading with Timothy Sykes, renowned for his expertise in penny stocks. Explore his top picks and discover the strategies that have propelled him to success with these articles:
- Penny Stocks Trading Guide
- Best Penny Stocks Under $1 to Buy Today
- Top 8 Penny Stocks to Watch on Robinhood
Once you’ve got some stocks on watch, elevate your trading game with StocksToTrade the ultimate platform for traders. With specialized tools for swing and day trading, StocksToTrade will guide you through the market’s twists and turns.
Dig into StocksToTrade’s watchlists here:





Leave a reply