

FedEx Freight Holding Company Inc. stocks have been trading up by 15.89 percent amid strong logistics demand and profit outlook improvements
Key Takeaways
- Recent trading shows FDXF breaking out above prior consolidation, with the stock pushing into the high-$120s on rising volume.
- Daily FDXF candles reveal a steady uptrend from the low-$110s, rewarding traders who respected the trend instead of fighting it.
- Financials show FedEx Freight Holding Company Inc. generating $8.80B in revenue with positive margins but heavy debt and negative equity.
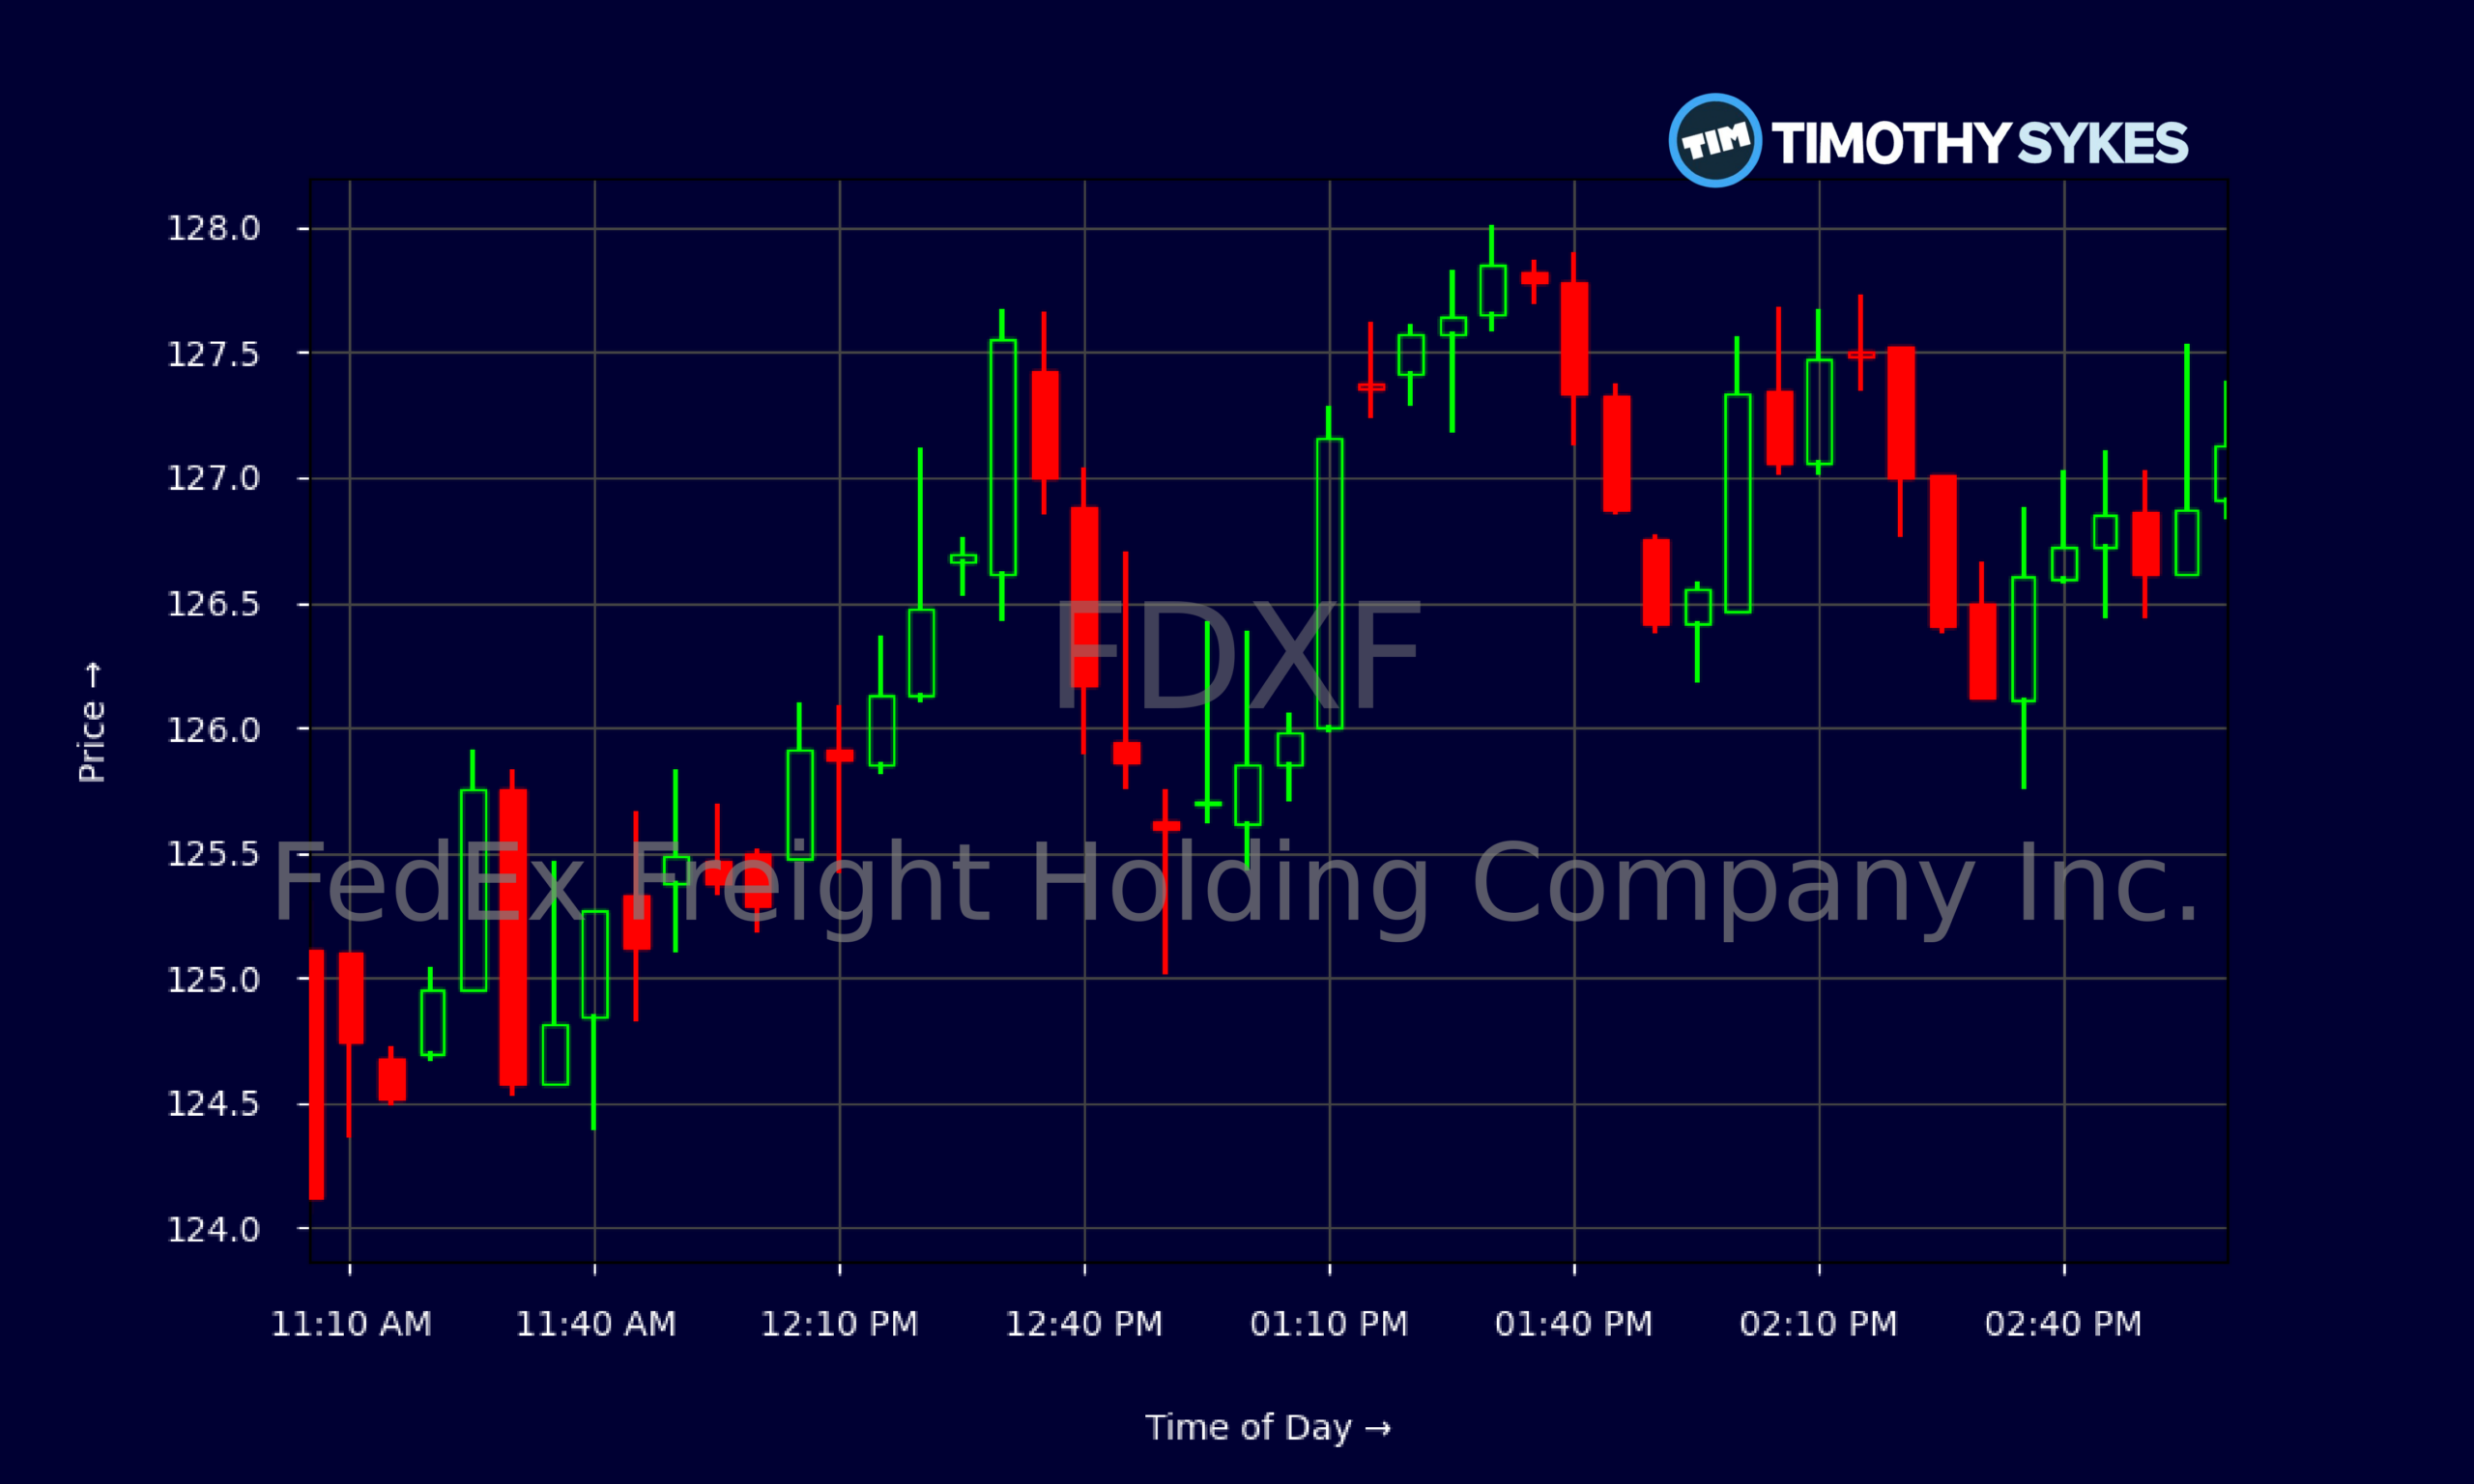
- Intraday FDXF action highlights clean pullbacks and higher lows, offering multiple dip-buy opportunities for active traders.
Live Update At 15:03:28 EDT: On Friday, October 30, 2026 FedEx Freight Holding Company Inc. stock [NYSE: FDXF] is trending up by 15.89%! Discover the key drivers behind this movement as well as our expert analysis in the detailed breakdown below.
Quick Financial Overview
FedEx Freight Holding Company Inc., trading under ticker FDXF, is posting serious top-line numbers while carrying a complex balance sheet. Revenue runs around $8.80B, which is big for any freight-focused name, and pretax profit margin near 9.9% shows FDXF is not just moving boxes — it is doing it profitably. Return on assets of 4.39% tells traders the company is squeezing real earnings out of its trucks, terminals, and equipment.
Valuation gets interesting. FDXF trades at roughly 8.67 times sales, which is rich territory for a traditional transport-style business. The kicker is negative book value, with book value per share around -$3.32 and price-to-book near -34.74. That screams balance sheet leverage and accounting adjustments rather than classic “asset-heavy” support.
More Breaking News
On the cash side, FDXF ended the latest quarter with about $251M in cash and total assets of roughly $6.88B, but long-term debt and capital lease obligations stack up to about $6.15B. Operating cash flow for the quarter ran negative at about -$346M, while net income stayed positive at $158M. For traders, this mix says one thing: FDXF is a momentum and sentiment name, not a conservative cash-cow play.
Why Traders Are Watching FDXF Price Action
FDXF has been grinding higher on the daily chart, and that trend is what has traders glued to the screen. Over the recent stretch, FedEx Freight Holding Company Inc. climbed from closes around $111–$113 up into the $127 area, with only shallow pullbacks along the way. Every dip toward the low-$100s and then the low-$110s has been bought, and that steady pattern gives momentum traders a clear playbook.
Look at the most recent session. FDXF opened near $115.20, exploded quickly into the mid-$120s in the first hour, then spent the day stair-stepping higher in a tight range. The low stayed anchored at the open price, while the high ticked up to $128 with a close just under that at $127.13. For FedEx Freight Holding Company Inc., that’s classic trend-day behavior: strong open, controlled consolidations, and a firm close near the high.
Zooming into the intraday five‑minute chart, FDXF shows textbook patterns the Sykes-style community loves to study. Early morning volatility from $115–$125 set the tone, followed by midday consolidations in the mid-$120s and a series of higher lows into the afternoon. Each pullback in FDXF — $125 to $124, $126 to $125.50 — found support instead of panic selling.
This kind of controlled strength tells traders that short-sellers in FDXF are getting squeezed while dip-buyers remain in charge. As long as FedEx Freight Holding Company Inc. holds above key prior support zones on the daily, breakout and dip-buy strategies remain front and center for active day traders and swing traders.
Conclusion
FDXF is a classic example of why price action always gets the final vote. FedEx Freight Holding Company Inc. shows solid revenue, positive margins, and real assets, but it is also carrying heavy debt, negative equity, and recently negative operating cash flow. On paper, that balance sheet is not “safe.” Yet the stock keeps grinding higher because traders respect the trend, not the story.
For short-term traders, the key levels are crystal clear. On the upside, recent highs in the $127–$128 range form the current resistance zone to watch. On the downside, the low-$120s and then the $110–$112 region are the bigger support shelves that held earlier in the up move. As long as FDXF continues to make higher lows on the daily chart, FedEx Freight Holding Company Inc. stays on momentum watch lists.
The takeaway for newer traders studying FDXF is simple: learn to read the chart and line it up with the fundamentals, but let price confirm your bias. Tim Sykes likes to say, “The market doesn’t care about your opinion, only your preparation.” As millionaire penny stock trader and teacher Tim Sykes says, “Embrace the journey, the ups and downs; each mistake is a lesson to improve your strategy.”. That fits FDXF perfectly. FedEx Freight Holding Company Inc. rewards traders who show up with a plan, cut losses fast when levels fail, and react to what the stock is actually doing — not what they hope it will do. This article is for educational and research purposes only and is not advice.
This is stock news, not investment advice. Timothy Sykes News delivers real-time stock market news focused on key catalysts driving short-term price movements. Our content is tailored for active traders and investors seeking to capitalize on rapid price fluctuations, particularly in volatile sectors like penny stocks. Readers come to us for detailed coverage on earnings reports, mergers, FDA approvals, new contracts, and unusual trading volumes that can trigger significant short-term price action. Some users utilize our news to explain sudden stock movements, while others rely on it for diligent research into potential investment opportunities.
Dive deeper into the world of trading with Timothy Sykes, renowned for his expertise in penny stocks. Explore his top picks and discover the strategies that have propelled him to success with these articles:
- Penny Stocks Trading Guide
- Best Penny Stocks Under $1 to Buy Today
- Top 8 Penny Stocks to Watch on Robinhood
Once you’ve got some stocks on watch, elevate your trading game with StocksToTrade the ultimate platform for traders. With specialized tools for swing and day trading, StocksToTrade will guide you through the market’s twists and turns.
Dig into StocksToTrade’s watchlists here:





Leave a reply