

Blue Owl Capital Inc. stocks have been trading up by 6.74 percent after strong fundraising momentum and upbeat analyst sentiment.
Key Takeaways For OWL Traders
- Shares of Blue Owl Capital are still down about 67% from early‑2025 highs, even as bankers float full or partial sale ideas and management tries to pivot beyond pure private credit.
- A Wall Street Journal report says investment bankers are exploring a sale of Blue Owl Capital, with TD Cowen flagging scarcity value and naming groups like T. Rowe Price and Carlyle as potential buyers.
- Wells Fargo started coverage of OWL at Equal Weight with a $10 target, signaling a wait‑and‑see stance while the firm works through recent underperformance.
- TD Cowen boosted its OWL price target from $15 to $16 and made it a top pick among traditional asset managers heading into Q3 earnings.
- Blue Owl Capital is capping redemptions from two private credit funds at 5%, yet the stock still gained around 1.5%–2.7% as traders focused on liquidity control and fund stability.
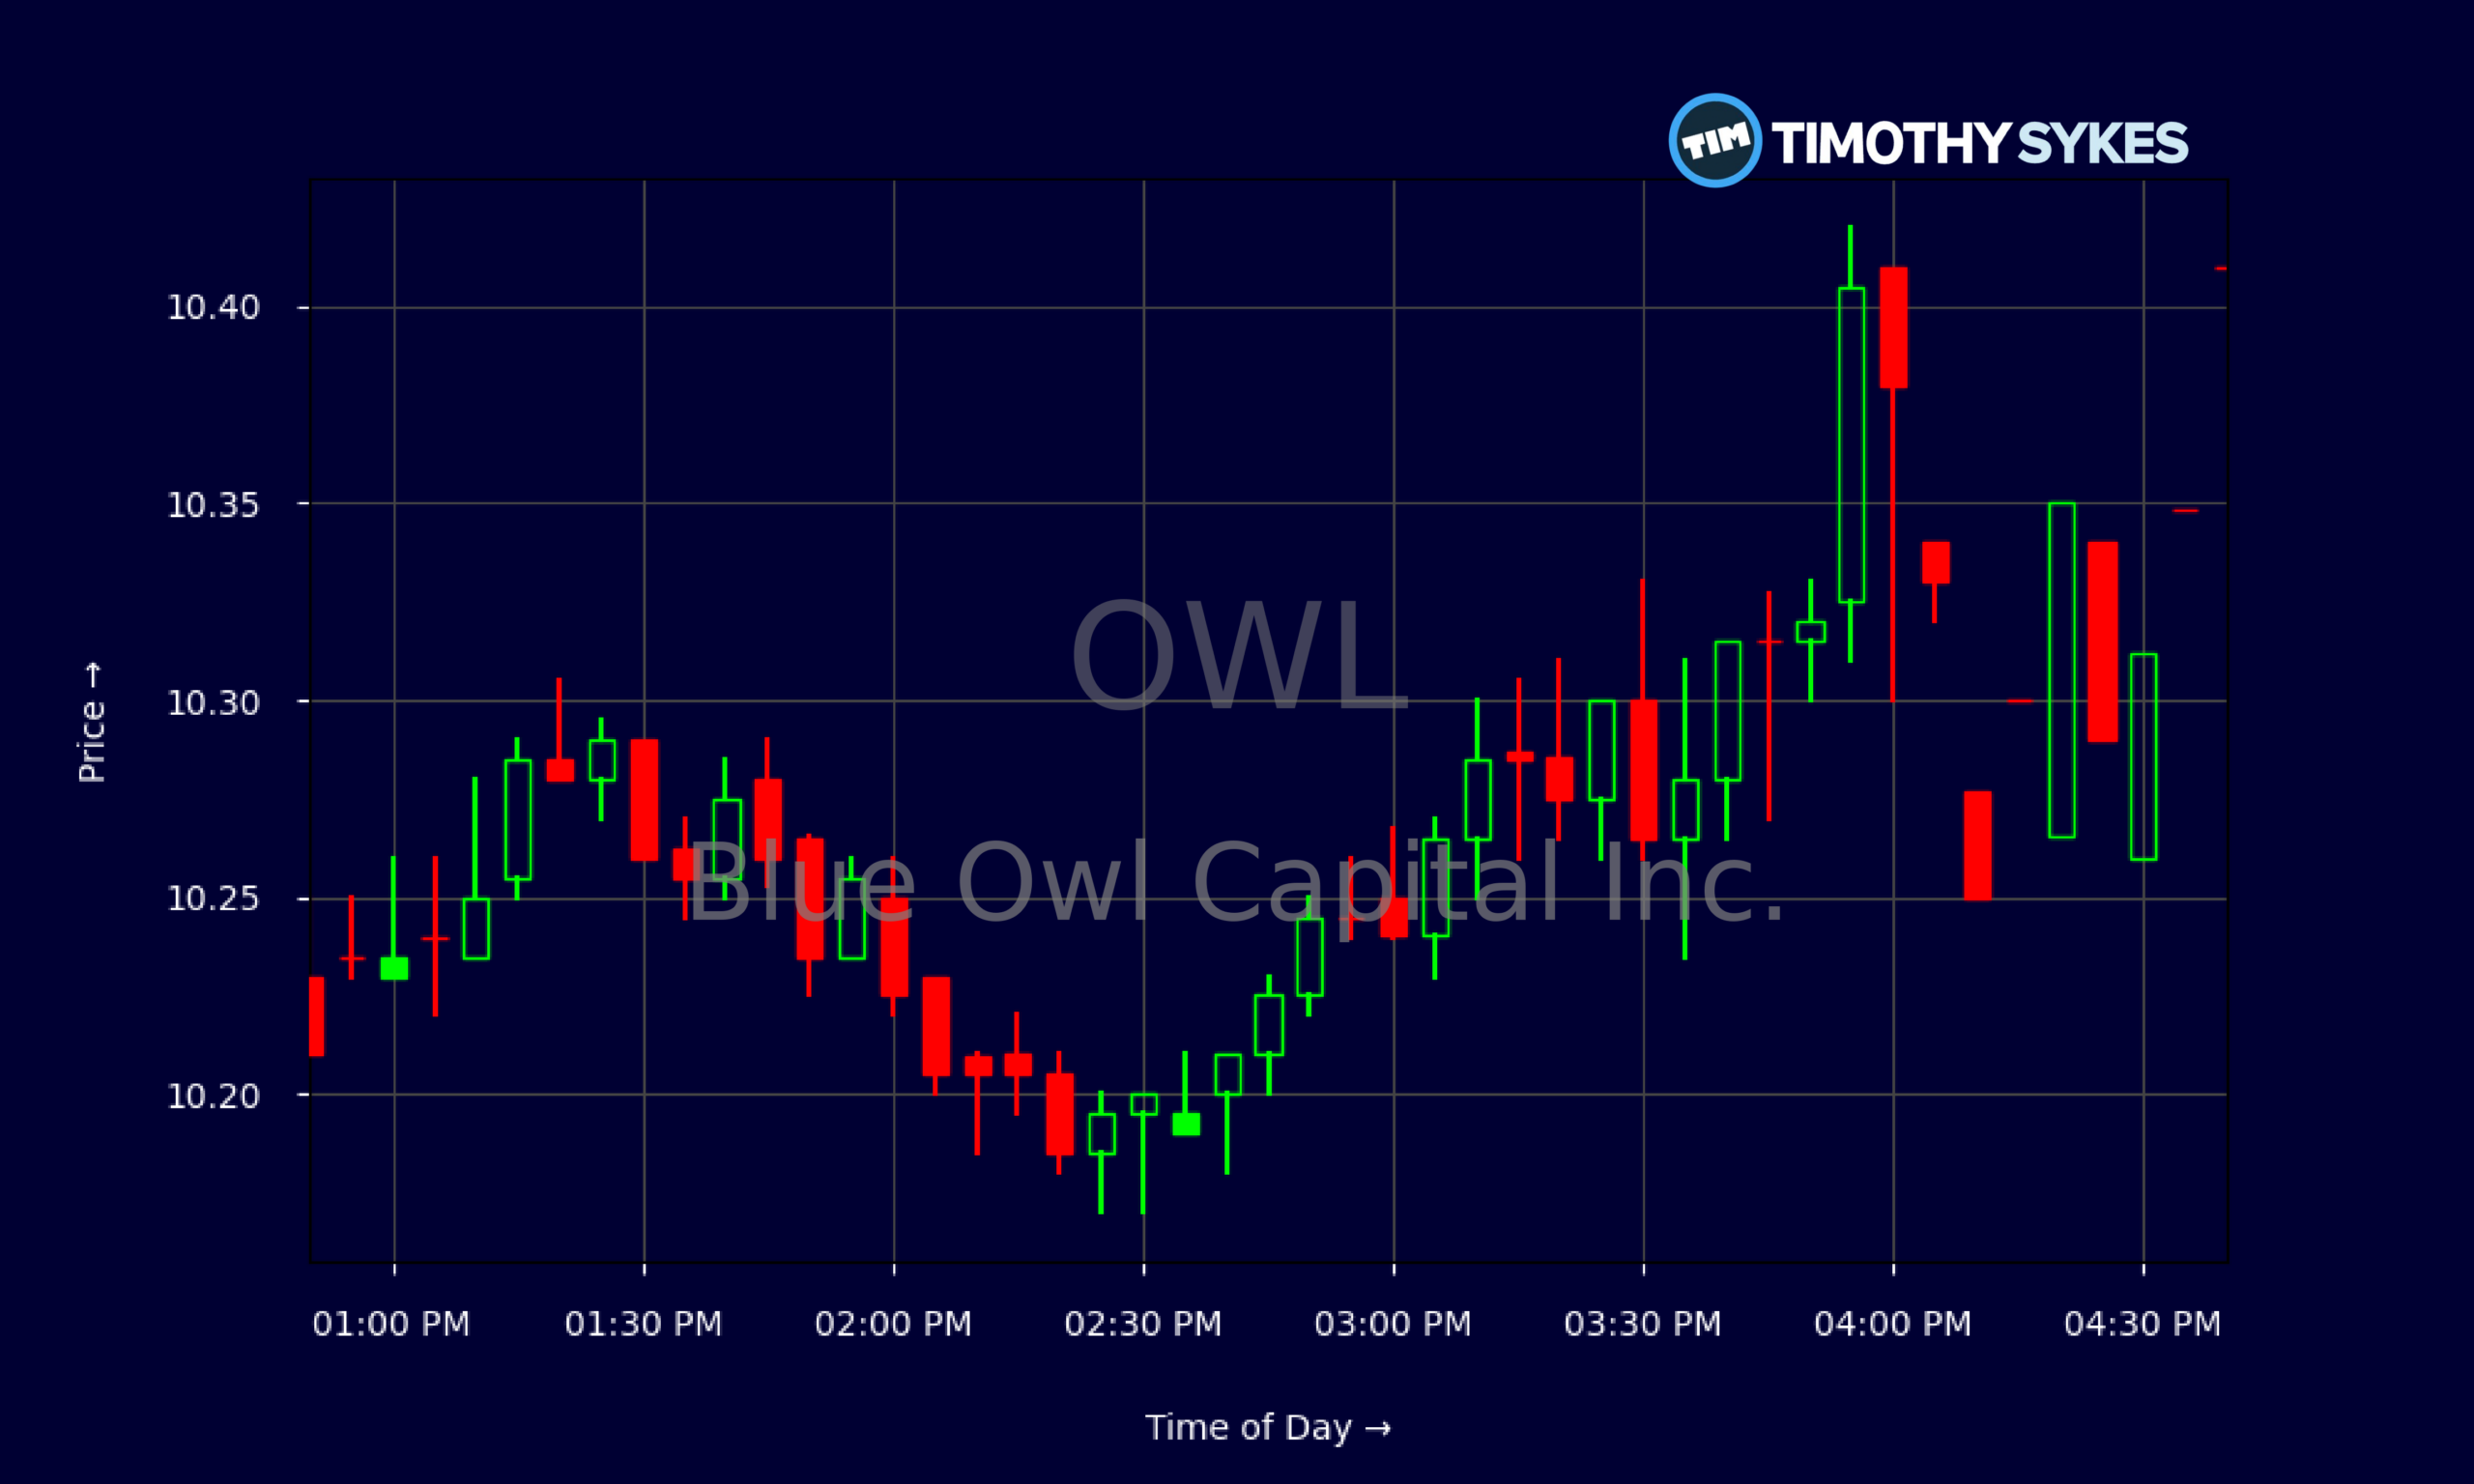
Live Update At 16:47:02 EDT: On Thursday, October 29, 2026 Blue Owl Capital Inc. stock [NYSE: OWL] is trending up by 6.74%! Discover the key drivers behind this movement as well as our expert analysis in the detailed breakdown below.
Quick Financial Overview
OWL has spent October grinding higher, and the tape finally shows it. The stock climbed from around $8.97 on 2026/10/05 to $10.41 on 2026/10/29, a roughly 16% move in three weeks. That’s a solid trend, especially for a name that was crushed about 67% from its early‑2025 peak.
Intraday action on 2026/10/29 shows steady, controlled buying rather than a wild squeeze. OWL opened near $9.80, dipped briefly, then walked higher all day, holding the $10.20–$10.40 band into the close. No blow‑off top, no panic wicks. That tells traders there is real two‑sided volume, not just a headline spike.
More Breaking News
Fundamentally, Blue Owl Capital is a fee machine. Revenue sits near $2.87B with revenue growth above 20% over three years. Profit margins on a continuing basis are in the low‑teens, but net profit margin on total operations is closer to 3%, which explains the lofty 79x P/E. OWL is paying out a fat $0.92 annual dividend, roughly a 9.5% yield at recent prices, backed by about $453M in quarterly free cash flow. Debt is heavy, with leverage north of 6x and long‑term debt above $3.8B, so traders must respect the rate backdrop. In short: strong cash generation, high yield, but a leveraged balance sheet and premium multiple.
Why Traders Are Watching OWL Now
The real story for OWL traders is the clash between deep drawdown and fresh catalysts. Blue Owl Capital’s stock is still down about 67% from its January 2025 peak, which is exactly the kind of long downtrend that forces weak hands out. That kind of damage often attracts event‑driven money, and that is what we’re seeing now.
According to a Wall Street Journal report, investment bankers are actively exploring a full or partial sale of Blue Owl Capital. TD Cowen points to “deep fundamental value” and “scarcity value” as consolidation rolls through the asset‑management space, and even flags potential strategic buyers like T. Rowe Price and Carlyle. For short‑term traders, that sale chatter is gasoline. Even without a signed deal, the headline flow can support OWL and keep shorts nervous.
At the same time, management is not standing still. OWL is capping redemptions from two private credit funds at 5%. Gating redemptions usually raises eyebrows, but the stock actually climbed between about 1.5% and 2.7% on the news. That tells the market many traders see the cap as a stability move, not a distress flare.
Strategically, Blue Owl Capital is pushing into a bigger insurance‑related platform using a “balance‑sheet‑light” model to lock in long‑duration capital, and it is deploying serious money into AI and data center infrastructure. The Stack Infrastructure unit is arranging an A$8.6B (roughly $6B) loan for a major Melbourne data center project, one of the largest in Asia. Separately, a $363M IREN equipment financing and new financing to Skylight through Wingspire showcase OWL’s reach in AI‑infrastructure and private credit. Those are real, fee‑rich deals that help justify why multiple banks still lean positive.
On the Street, the picture is mixed but supportive. TD Cowen raised its OWL target from $15 to $16 and calls it a top pick ahead of Q3. Piper Sandler trimmed its target from $13 to $12 but stayed Overweight, while BMO cut from $12 to $11 and stayed Outperform, both citing macro and higher‑for‑longer rate pressure. Wells Fargo sits in the middle with an Equal Weight and a $10 target. For traders, that blend spells choppy upside, not a clean breakout—yet.
Conclusion
For active traders, OWL now sits at the intersection of turnaround, yield, and M&A optionality. Blue Owl Capital is still working through a massive drawdown, heavy leverage, and a higher‑rate world that weighs on alternative managers. At the same time, the firm is printing meaningful free cash flow, paying a near‑double‑digit dividend, and securing headline‑worthy financing mandates tied to AI infrastructure and data centers. That combination is why the stock has quietly pushed from the high‑$8s into the low‑$10s in October.
The sale exploration reported by the Wall Street Journal adds another layer. Even talk of a potential Blue Owl Capital sale to platforms like T. Rowe Price or Carlyle keeps a floor under the story because it signals that strategic buyers see value the tape forgot. But traders should remember: rumors are not contracts. The real confirmation will come from Q3 numbers due 2026/10/29 and the tone on that earnings call around fund flows, redemptions, and fee growth.
Blue Owl Capital will stay on many watchlists as long as the chart holds the $10 zone and headlines stay hot. In the words of Tim Sykes, “The market doesn’t care about your opinion, it cares about catalysts and price action.” As millionaire penny stock trader and teacher Tim Sykes says, “Cut losses quickly, let profits ride, and don’t overtrade.” OWL has both right now. For educational and research‑driven traders who study the chart, respect risk, and react to news, this is exactly the type of complex, catalyst‑rich setup worth tracking day by day.
This is stock news, not investment advice. Timothy Sykes News delivers real-time stock market news focused on key catalysts driving short-term price movements. Our content is tailored for active traders and investors seeking to capitalize on rapid price fluctuations, particularly in volatile sectors like penny stocks. Readers come to us for detailed coverage on earnings reports, mergers, FDA approvals, new contracts, and unusual trading volumes that can trigger significant short-term price action. Some users utilize our news to explain sudden stock movements, while others rely on it for diligent research into potential investment opportunities.
Dive deeper into the world of trading with Timothy Sykes, renowned for his expertise in penny stocks. Explore his top picks and discover the strategies that have propelled him to success with these articles:
- Penny Stocks Trading Guide
- Best Penny Stocks Under $1 to Buy Today
- Top 8 Penny Stocks to Watch on Robinhood
Once you’ve got some stocks on watch, elevate your trading game with StocksToTrade the ultimate platform for traders. With specialized tools for swing and day trading, StocksToTrade will guide you through the market’s twists and turns.
Dig into StocksToTrade’s watchlists here:




Leave a reply