

Medical Properties Trust Inc. stocks have been trading down by -14.14 percent amid heightened concerns over tenant financial stability.
Key Takeaways
- Shares of Medical Properties Trust Inc. have dropped from about $3.30 to near $2.10 over recent sessions, putting MPT back near 52-week support territory.
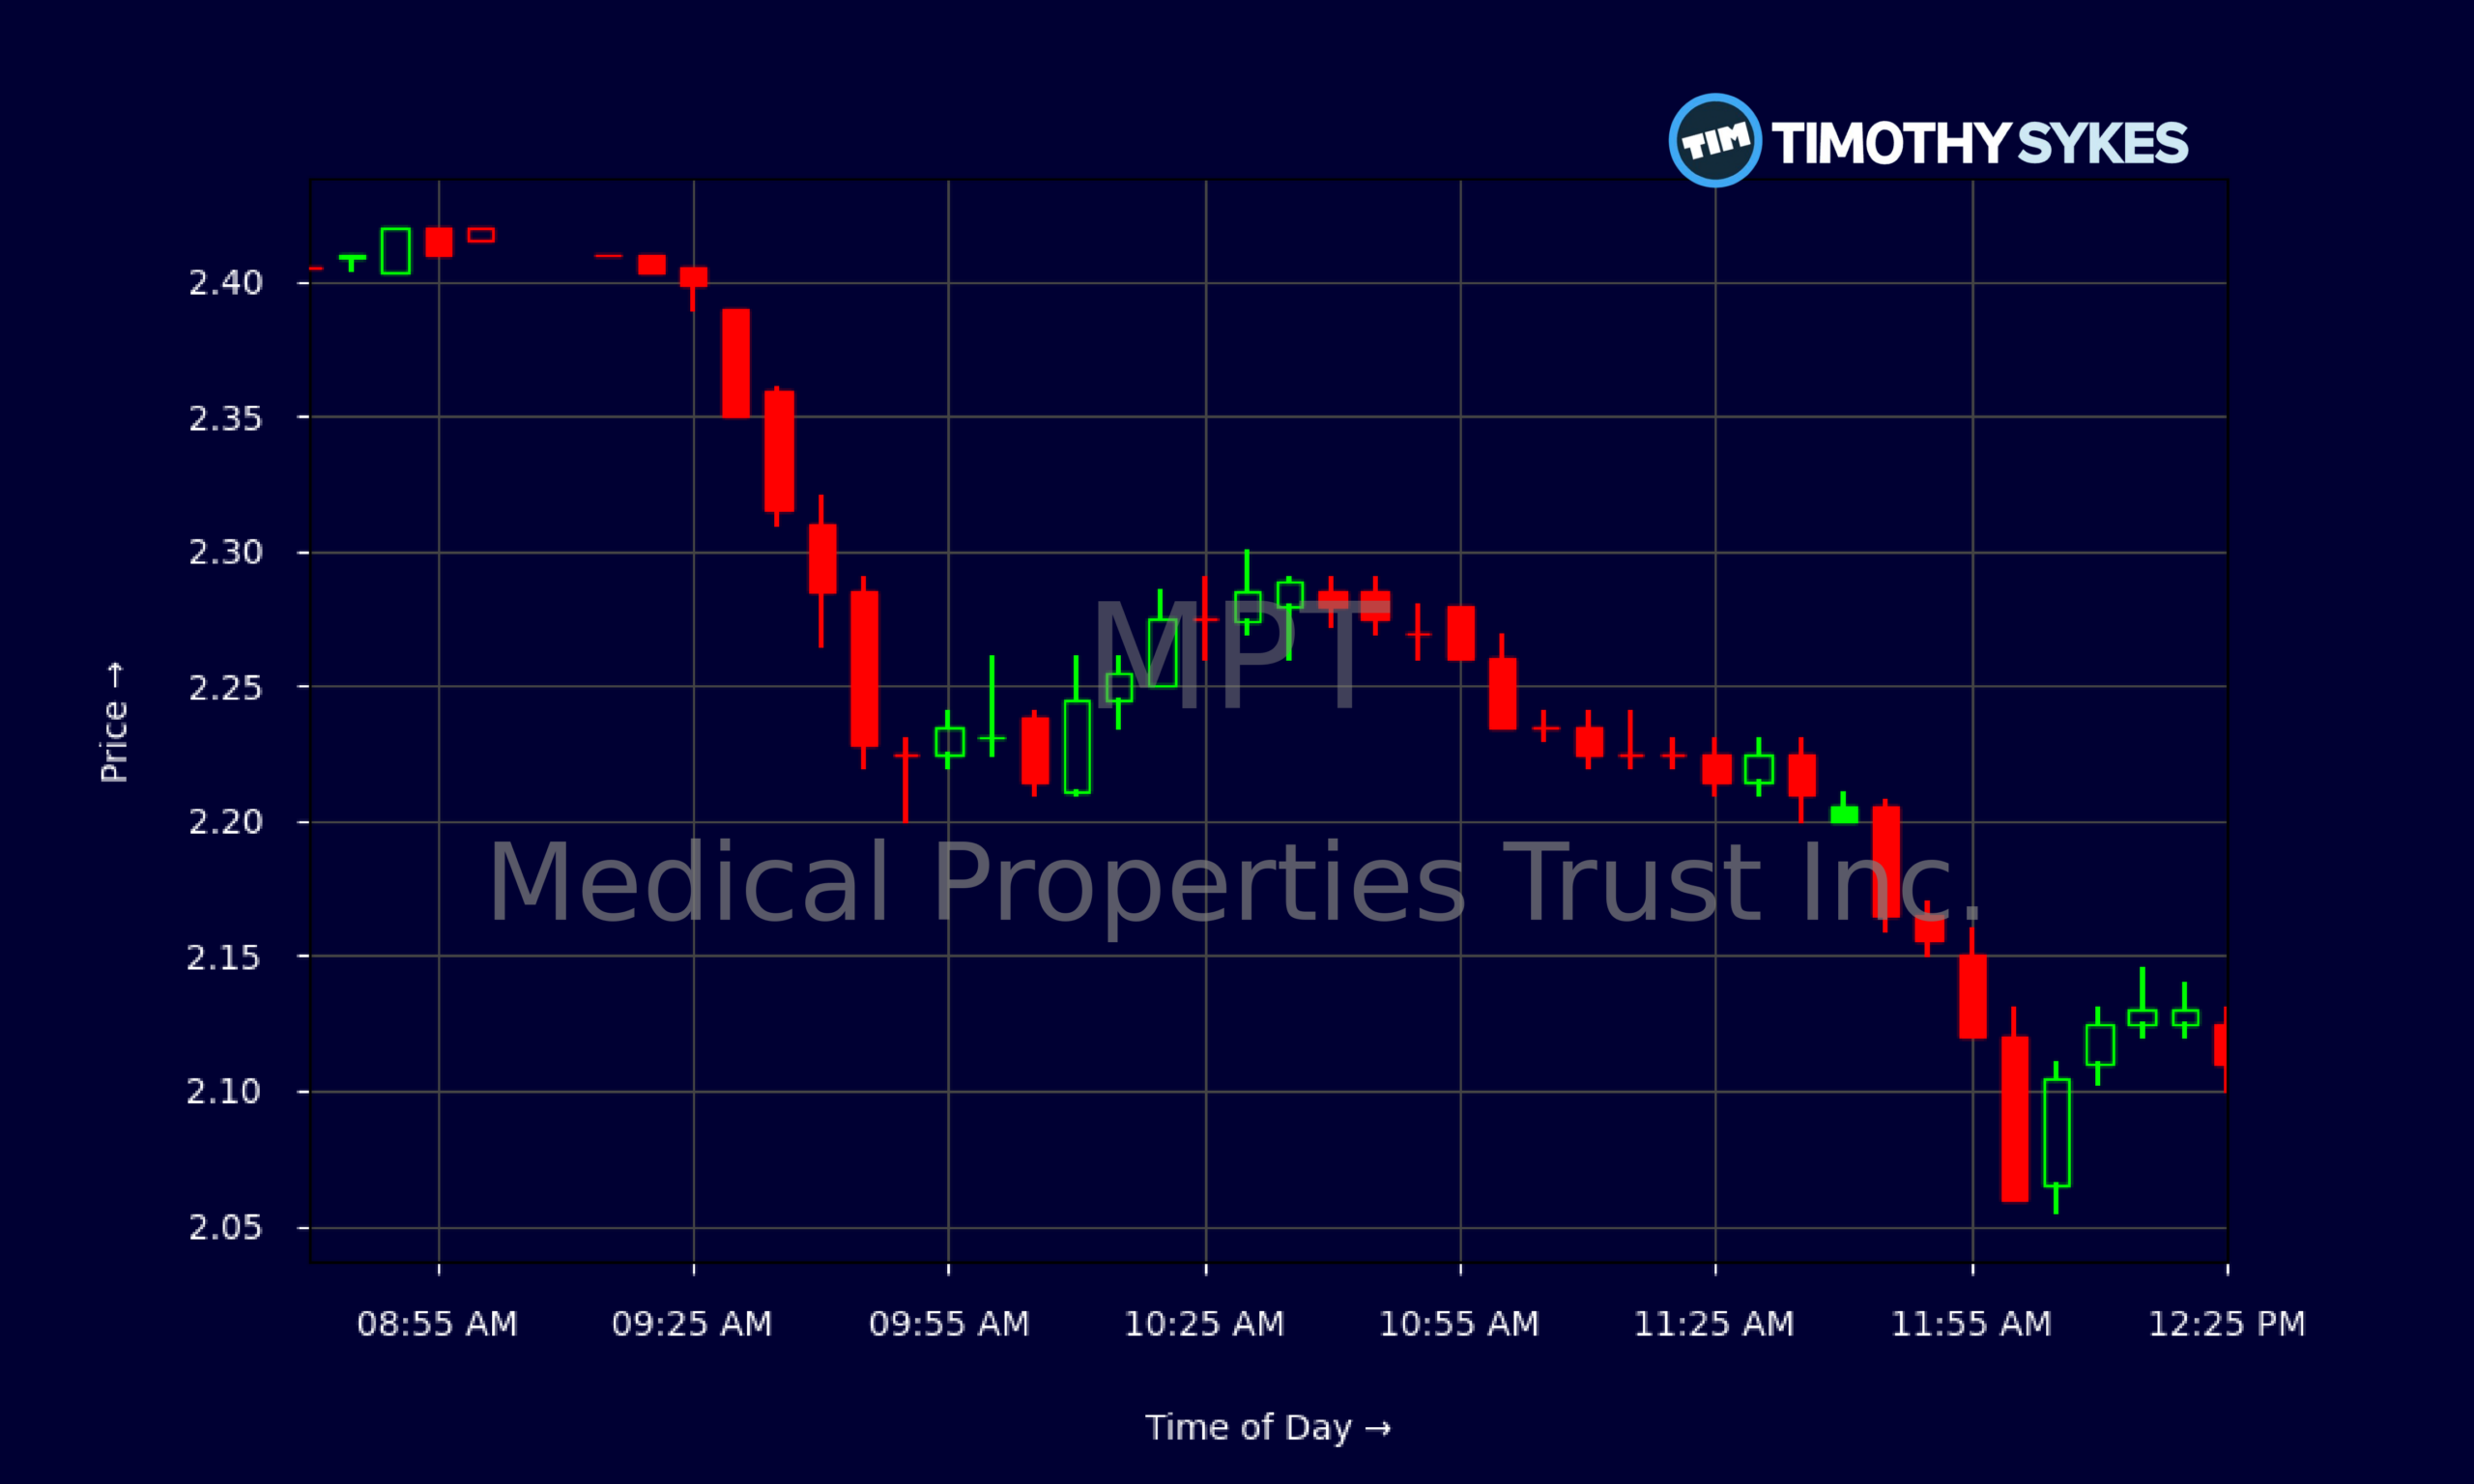
- Intraday trading shows heavy selling early, followed by low-volume stabilization around $2.10, signaling potential short-term consolidation for MPT.
- The latest quarter shows MPT generating $259.3M in revenue but posting a small net loss, keeping pressure on sentiment.
- Medical Properties Trust Inc. carries high leverage, with debt more than twice equity, so balance sheet risk remains central for traders in MPT.
- Cash flow remains positive, giving MPT some runway, but traders are treating the stock as a turnaround, not a growth story.
Live Update At 12:32:06 EDT: On Friday, October 30, 2026 Medical Properties Trust Inc. stock [NYSE: MPT] is trending down by -14.14%! Discover the key drivers behind this movement as well as our expert analysis in the detailed breakdown below.
Quick Financial Overview
Medical Properties Trust Inc. is trading like a distressed income REIT, and the numbers explain why. Over the past couple of weeks, MPT has slipped from closes around $3.30 to roughly $2.10. That is a steep drawdown, and traders are clearly repricing risk.
On the fundamental side, MPT reported quarterly revenue of about $259.3M, with gross margin above 90%. That’s typical for a landlord collecting rent, but the story gets messy below the top line. After interest and one‑time charges, Medical Properties Trust Inc. ended up with a small net loss of roughly $2.6M and a negative EPS around -$0.01. For traders, that’s a reminder that earnings power is fragile.
More Breaking News
Leverage is the real overhang. Total liabilities sit near $10.2B against total equity of about $4.5B, and long-term debt alone is close to $9.0B. The key ratio here: total debt-to-equity over 2x. At the same time, MPT is throwing off around $62.4M in quarterly operating cash flow, with cash on hand near $396.6M. So Medical Properties Trust Inc. is not out of fuel, but the margin for error is thin, and the chart reflects that tension.
Why Traders Are Watching MPT Price Action
When you pull up the daily chart, Medical Properties Trust Inc. looks like a slow-motion rug pull. Earlier in the month, MPT was closing near $3.30. Then the stair-step lower began: multiple red days, failed bounces, and now a close near $2.10. For active traders, that kind of trend is a textbook downtrend — lower highs, lower lows, and sentiment getting squeezed.
Zoom into the intraday tape and you see the psychology in real time. MPT opened around $2.39 and sold off quickly toward $2.20, with big candles during the first trading hour. That early flush tells you weak hands were dumping. After about 11:00, the range tightened, and Medical Properties Trust Inc. started grinding between roughly $2.21 and $2.16, then faded again to about $2.09 into midday. That shift from high volatility to tighter consolidation often signals traders are waiting for the next catalyst or technical break.
Underneath that chart, the fundamentals of MPT explain why dips keep getting sold. Medical Properties Trust Inc. has a price-to-book ratio around 0.42, so the market is valuing the equity at less than half of stated book value. On paper, that screams “deep discount.” But heavy leverage, interest coverage near 1x, and negative bottom-line margins are why many traders see a value trap instead of a bargain.
Still, traders love beaten-down names that can squeeze. Any hint of improved cash flow or balance sheet progress can trigger sharp, short-term spikes. That’s why MPT keeps showing up on watchlists, even as Medical Properties Trust Inc. bleeds lower overall.
Conclusion
Right now, Medical Properties Trust Inc. is a classic high-risk REIT setup: ugly trend, scary leverage, but real cash flow and a loyal base of income-focused traders. The stock has broken down from the low-$3s to the low-$2s, with intraday price action showing a clear pattern of morning selloffs and midday stabilizing. That usually means emotion is high, and algos are in control.
For short-term traders, the key levels are simple. On the downside, that $2.05–$2.10 zone is acting like near-term support; if MPT loses that area with volume, you treat it as a potential breakdown and respect the risk. On the upside, any reclaim and hold above $2.40–$2.50 would show Medical Properties Trust Inc. can attract dip buyers again, at least for a trade.
On the fundamental front, MPT’s combination of a roughly 0.4x price-to-book and high debt means every quarter matters. Positive operating cash flow and a large asset base give Medical Properties Trust Inc. time, but not unlimited time. As Tim Sykes likes to say, “The market doesn’t care about your opinion, only the price action. React to the chart, don’t predict it.” As millionaire penny stock trader and teacher Tim Sykes, says, “It’s better to go home at zero than to go home in the red.”. Traders studying MPT should keep that mindset: map your levels, size small, cut losses fast, and treat every bounce or breakdown as a trading lesson, not a promise.
This is stock news, not investment advice. Timothy Sykes News delivers real-time stock market news focused on key catalysts driving short-term price movements. Our content is tailored for active traders and investors seeking to capitalize on rapid price fluctuations, particularly in volatile sectors like penny stocks. Readers come to us for detailed coverage on earnings reports, mergers, FDA approvals, new contracts, and unusual trading volumes that can trigger significant short-term price action. Some users utilize our news to explain sudden stock movements, while others rely on it for diligent research into potential investment opportunities.
Dive deeper into the world of trading with Timothy Sykes, renowned for his expertise in penny stocks. Explore his top picks and discover the strategies that have propelled him to success with these articles:
- Penny Stocks Trading Guide
- Best Penny Stocks Under $1 to Buy Today
- Top 8 Penny Stocks to Watch on Robinhood
Once you’ve got some stocks on watch, elevate your trading game with StocksToTrade the ultimate platform for traders. With specialized tools for swing and day trading, StocksToTrade will guide you through the market’s twists and turns.
Dig into StocksToTrade’s watchlists here:





Leave a reply