One thing I’ve learned in over two decades of trading is how to use penny stock analysis to my advantage.
It’s weird to think about this, but I’ve been trading for over half my life now. I’ve seen a lot in the penny stock niche.
So I get why penny stocks get a bad rap. There are SO many stories about toxic financing and shady dealings. Many large investors avoid penny stocks completely because it’s too hard to find a diamond in the rough.
That’s where my skills, knowledge, and strategy come in…
Penny stocks are some of my favorite stocks to trade. Sure, they can be sketchy. But if you know what to look for, penny stocks can offer amazing opportunities. It all starts with your education.
For one, I NEVER invest in penny stocks…
Instead, I stick with day trading strategies to get a leg up on the market. Learn to lock in singles. The more you study penny stock analysis, the better you’ll get.
Let’s take a closer look at penny stock analysis and how you can use it in the markets…
Table of Contents
- 1 How Do You Analyze Penny Stocks?
- 2 Examples of Fundamental and Technical Penny Stock Analysis
- 3 Fundamental Analysis vs. Technical Analysis: Which Is Better?
- 4 The 3 Best Indicators for Penny Stock Analysis and Trading
- 5 Apply to the Trading Challenge
- 6 3 Hot Penny Stocks to Watch in 2021
- 7 Frequently Asked Questions About Penny Stock Analysis
- 8 Penny Stock Analysis: The Bottom Line
How Do You Analyze Penny Stocks?
Traders look at penny stocks from different angles.
Some try to find the rare stock that ends up doing well in the long run. Others will study a handful of patterns with the potential to help them profit in the short term.
Stick with the strategy that makes sense to you. If you want to invest in penny stocks, go right ahead. I don’t think it’s worth the time and stress.
There are two ways to approach penny stock analysis…
Fundamental Analysis

This kind of analysis helps traders gauge the quality of long-term investments. It’s less about patterns and more about financial performance.
Here, traders look for stocks that appear undervalued. These stocks trade below the price their financials indicate they’re worth. Sounds simple … but it takes a lot of trial and error.
You’ll look at documents like cash flow statements, income statements, and balance sheets to look for a strong financial foundation.
But it’s not black and white. It can take years to master, and you might not see results for months. And you’ll likely take way fewer trades than day traders.
And always remember … Anything can happen in this crazy market. Your stock could do well for months, but one bad day can wipe out any gains.
Technical Analysis
If you want to master penny stock analysis, you’ll need to know technical analysis like the back of your hand.
Instead of trying to measure a stock’s performance based on financials, you look at chart history to find potential trends or patterns.
You can usually see a stock’s entire history measured in volume and price points on a chart.
With enough experience, you can use this data to spot a pattern and learn to trade it. I rely on a handful of trading patterns, like the breakout and the panic dip buy. And I’ve used these patterns throughout my trading career. And I now teach this kind of penny stock analysis in my Trading Challenge.
Ready to learn more about some of my top trading patterns? Check out my FREE guide to penny stocks!
Examples of Fundamental and Technical Penny Stock Analysis

Let’s look at some examples…
Fundamental Analysis Example
Tesla Inc. (NASDAQ: TSLA) hit $900 per share earlier this year. It’s the powerhouse of the electric vehicle sector.
Investors typically look at details like earnings per share and dividends. But it wouldn’t be fair to say that Tesla took off only because of its financials…
For one, Elon Musk owns Tesla. He sent a car into space and built a reusable rocket. Many people view him as a super-genius who could potentially take us to Mars. This could indirectly add value to Tesla’s stock but wouldn’t necessarily show in the financials.
This is one reason fundamental analysis can be so tricky.
Technical Analysis Example
In penny stocks, history tends to repeat itself. That’s why you must study the charts … They can give you clues about what the stock might do next.
Say you’re looking at a hot penny stock’s daily chart. You notice that six months ago the stock went on a multi-day run from 10 cents to $1.
Since that run, the stock has faded off and found support around 50 cents. Say it consolidates for a few months, then starts making its way toward that previous high of $1.
This is a breakout pattern. The $1 level is a resistance point from the last run, meaning the stock couldn’t push through that price. As it approaches that key level, ask yourself these questions:
- Will it fail to pass that level again or break out above it?
- If it does break out, will it have another multi-day run?
- Are there any more potential resistance levels from further back on the chart?
If you want to use technical analysis to its full potential, this is just the tip of the iceberg. There are many more details of penny stock analysis that you need to learn and adapt to over time.
Don’t try to cheat the learning process — you’ll end up cheating yourself. Get my no-cost “Volatility Survival Guide” to learn how to adapt to a market that’s always changing.
Fundamental Analysis vs. Technical Analysis: Which Is Better?
I’m a day trader, so I rely mostly on technical analysis.
This type of penny stock analysis might not click with everyone. Practice and figure out what works for you.
Michael Goode is one of my earliest Challenge students now one of my chat room moderators. He trades almost entirely using fundamental analysis and now has over $2.6 million in profits.*
Then I have students like Matt Monaco and Mike “Huddie” Hudson who primarily use technical analysis. They’ve found a few patterns that made sense to them, then practiced and honed them for years.
It comes down to preference.

The 3 Best Indicators for Penny Stock Analysis and Trading
There are hundreds of indicators out there, but you don’t need them all for penny stock analysis.
Too many indicators can overcomplicate your trading plan. I try to keep mine as simple as possible.
For the record, I trade using seven indicators. That includes some fundamentals. Forget the labels of fundamental vs. technical. Look at the big picture. You can learn all seven indicators in the “Trader Checklist Part Deux” DVD available from the Profit.ly store.
For now, here are three top indicators for penny stock trading…
#1: VWAP
Almost every trader I know uses volume-weighted average price (VWAP) for penny stock analysis.
It takes the total dollar volume traded and divides it by the number of shares traded. This gives us the overall average price, usually displaying as a red line on the chart.
When a stock trades above VWAP, we know it’s above the average price paid. This could mean the stock is bullish. It’s the opposite when it’s trading below VWAP.
Picture a stock that’s been spiking all morning. When it starts to sell off, VWAP could be a good area for a dip buy. That’s because most traders own the stock near that price, so it could potentially act as support.
VWAP isn’t magic. But it can be an awesome tool for penny stock analysis.

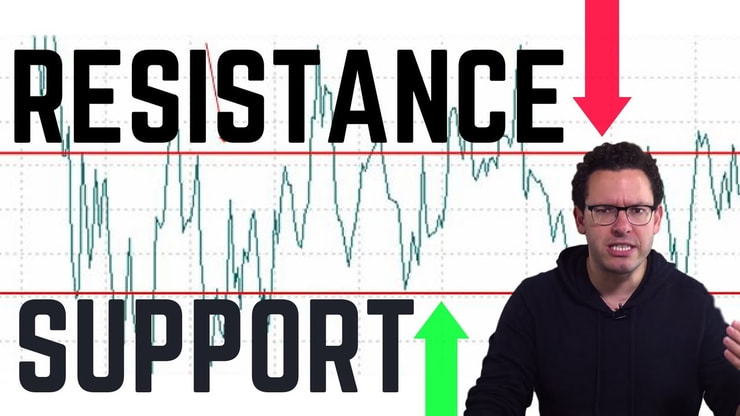
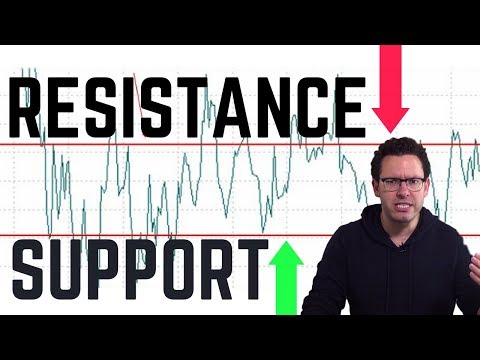
#2: Support and Resistance Levels
If you want to become a better day trader, you need to be able to identify support and resistance levels.
Support levels are below a stock’s current price. But you can’t just dip buy a stock and hope it’s near a support level. You have to find these levels on the stock’s chart by looking for areas of high volume. More buyers could mean more strength.
You’ll also find resistance levels in areas of high volume, but they’re usually above the current trading price. These are prices the stock has reached in the past but couldn’t break through.
Look for support and resistance levels on multiple time frames. You can find them on a one-day, one-month, or one-year chart.
#3: Moving Averages
There are two types of moving averages — simple and exponential. They both identify potential trends in a stock.
Moving averages change at different rates, depending on the time period. If you’re looking at a one-year daily chart, it probably won’t move very fast.
If on a one-day chart for a volatile stock, the moving averages can jump all over the place.
This could be a great indicator to know. Moving averages can give you a hint of where the stock is headed next.
But to me, there’s one day trading essential that outweighs ANY trading indicator — a quality education.
Apply to the Trading Challenge
That’s what my Trading Challenge is all about — a trading education. But you have to apply to be accepted. I only want the hardest-working traders.
My goal is for you to learn to think for yourself. If you can learn to navigate the markets on your own, find plays that fit your strategies, and adapt to the constantly changing markets…
You’re one step closer to making your dreams a reality. Apply for the Trading Challenge today and start your journey!
3 Hot Penny Stocks to Watch in 2021

If you haven’t already signed up for it, check out my no-cost weekly watchlist. It’s how you can learn the process I use to find potential plays.
If you’re serious about trading, you need to narrow your watchlist to only the best setups. Study the tickers I watch and figure out why I’m watching them.
To get you started, here are three hot penny stocks to study. Remember, this is only to help you learn the process, not a recommendation to trade. Study the charts, patterns, and catalysts to see why I watch stocks like these…
#1: Movement Industries Corp. (OTCPK: MVNT)
Here’s a recent spiker that got my attention. It looks like MVNT consolidated for months, forming a nice breakout level around 4 cents.
I missed the initial move, but if MVNT holds up and consolidates, it could run further.

#2: Quanta Inc. (OTCPK: QNTA)
Here’s another hot runner. QNTA issued a press release about plans to build a new lab in the Dominican Republic. That sparked a run. Check out the chart…

#3: PCT Ltd (OTCPK: PCTL)
This is a former runner from 2020. Ever since its first run to over 9 cents, PCTL has been on a steady downtrend.
But on April 30, the stock finally popped. And it traded over 200 million shares on the day. This could be enough to break the downtrend and allow the stock to make gains. I’ll be watching this one.

Frequently Asked Questions About Penny Stock Analysis
How Do You Know If a Penny Stock Is Undervalued?
Some traders use fundamental analysis to figure out if a penny stock is undervalued. They look for value in the company’s financials. Traders can also use technical analysis, like looking for a dip buy pattern, to trade an undervalued stock.
How Do You Know If a Penny Stock Will Spike?
There are many reasons a penny stock might spike. There could be news, like a positive earnings report or press release. Or the stock could be approaching a key breakout level. Study the price action and use its chart history to get a better idea of what the stock might do.
Can You Get Rich Off Penny Stocks?
It’s not easy, but it can be done. If you’re willing to work hard, you might have a shot at becoming a self-sufficient day trader. Some of my top students have made millions trading penny stocks.* But we’ve all worked for years and stay disciplined to make our dreams a reality.
Penny Stock Analysis: The Bottom Line

There are different ways to approach penny stock analysis. I don’t invest in penny stocks — I trade them. But you do you.
You can use fundamental analysis to dig through the filings and maybe find an undervalued stock…
Or you can study day trading strategies that rely on technical analysis. I use these strategies to lock in profits when a stock finds momentum.
Both types of penny stock analysis can take a LONG time to master. Some of my top students didn’t become self-sufficient for years.
So if you aren’t prepared to do the same, you might want to consider a different activity. But if you are, study every day and practice until it clicks.
What do you think of penny stock analysis and how do you approach it? Let me know in the comments!

Disclaimers
*Please note that any reported trading results are not typical. Most traders lose money. It takes years of dedication, hard work, and discipline to learn how to trade. Individual results will vary. Trading is inherently risky. Before making any trades, remember to do your due diligence and never risk more than you can afford to lose.
This level of successful trading is not typical and does not reflect the experience of the majority of individuals using the services and products offered on this website. From January 1, 2020, to December 31, 2020, typical users of the products and services offered by this website reported earning, on average, an estimated $49.91 in profit. This figure is taken from tracking user accounts on Profit.ly, a trading community platform. Timothy Sykes has a minority shareholder interest in the platform. The typical success rate of users was based on the following methodology:
- From January 1, 2020, to December 31, 2020, 849,078 trades were uploaded to Profit.ly. 633,891 trades were “verified” (corroborated with trade account data).
- Instructor trades are ignored.
- Average P&L / trades is obtained by calculating total P&L and dividing by the total number of trades
- Average trades per account is obtained by counting the total number of trades and dividing by the number of accounts (mean function)

Leave a reply