Trading breakout stocks can be a good place to start for new traders. It starts with a simple pattern…
Once you learn some basic technical analysis skills, you can learn to recognize the pattern. And there are some simple strategies for entering trades. It’s also usually clear when the pattern’s not working and you need to cut losses.
But not all breakout stocks are created equal. Not all of them work, and they all look a little different.
So in this post, I’ll help you out with some breakout stock trading strategies and stocks to watch. I’ll also give you some examples of my own trades on breakout stock.
Let’s start with the basics…

Table of Contents
What’s a Stock Breakout?
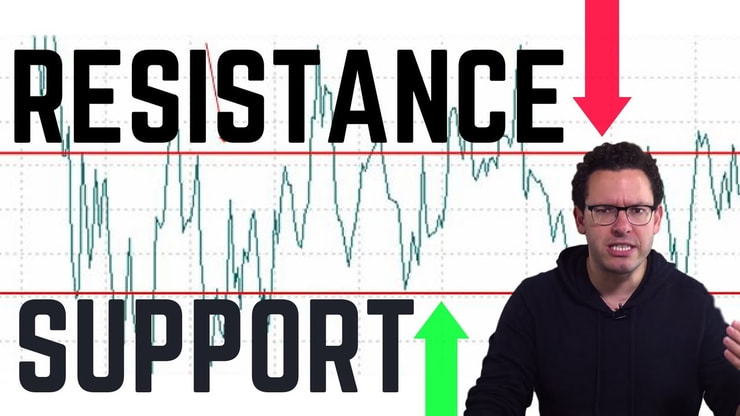
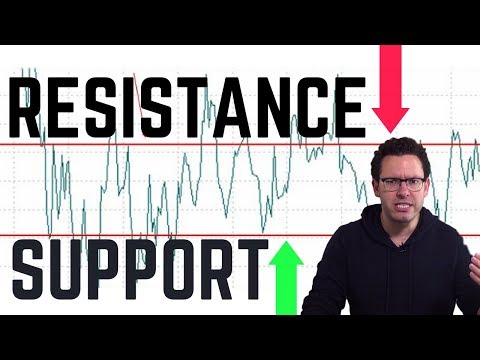
A breakout is a technical chart pattern. It means a stock has broken above a previous resistance level. The resistance level can be from a few days or weeks prior, or you can have stocks making new yearly or all-time highs.
It’s usually a buy signal for traders. It can signal the start of an uptrend that could last a day or two, or it could spark a longer-term trend.
What Causes a Stock Breakout?

A stock breakout can be caused by a simple catalyst, or it could be a combination of factors. As more catalysts align to create a breakout, that usually results in a more powerful move.
The biggest breakouts combine a technical chart breakout with a news catalyst, high volume, and ideally a hot sector. These breakout stocks can have huge percent gains.
You want enough volume for the new highs to continue. High volume tells you there’s a lot of traders watching the stock.
How Do You Confirm a Breakout?
Again, not all breakout stocks are created equal. Some will break above the breakout level, then get pushed right back down. Breakouts aren’t a guaranteed win. Like everything in trading, it’s risky and not an exact science.
So when trading a breakout, I like it to confirm it’s gonna hold the breakout level.
Confirming a breakout means after the initial breakout, I like it to come back down and test the breakout level. Then I want to see enough buyers come in so the stock holds, then bounces and continues up.
The initial breakout above the high could be big or small depending on the stock’s range. The important thing is that it holds above the breakout level.
Other traders, like my top student Tim Grittani, give stocks more room. He’ll let a stock dip below the breakout level slightly before cutting the trade.
Once you have more experience in the markets, you’ll get a sense of price action and what a regular dip looks like versus a failed breakout.
Stock Breakout Indicators

You can see the breakout on a candlestick chart when the price breaks above an area of resistance. We’ll get to some chart examples in a bit.
An indicator you want to see with a breakout is high volume. A breakout combined with volume will have higher odds of continuing higher. It means more traders are watching and joining the momentum.
High volume can also mean a lot of short sellers are buying to cover. If it’s a heavily shorted stock, it could lead to a giant short squeeze.
To be able to spot a breakout, you’ll need to understand technical analysis and support and resistance areas. To learn more, check out this video…
How Do You Calculate Breakout Volume?
Like I said, you want to see high volume with breakout stocks. But what’s considered high volume?
One thing I like to look for is a higher than average volume for the stock. The average volume is the average number of shares traded on a regular trading day. StocksToTrade will show you the average volume along with the float and the 52-week highs and lows.
Or you can use the volume indicator on your charting software. You want to see volume bars that are higher on the day of the breakout than an average trading day.
How to Trade Breakout Stocks
Breakouts are usually an indicator that the stock is headed higher. It’s a buy signal for most momentum traders, swing traders, and day traders.
Never buy in anticipation of a breakout. I never try to predict the market or a stock. I always react. So when it comes to buying a breakout stock, I wait for the breakout to actually happen. Once the stock is above the breakout level, I want to see strength and volume.
I’ll get into three strategies for trading breakout stocks a bit later, keep reading…
I have over 650 video lessons on trading breakout stocks on Profit.ly. You can access my video lessons with a Penny Stocking Silver subscription. But if you want the same education as my millionaire students, apply for my Trading Challenge.*
If you’re accepted you’ll not only have access to all my video lessons but you’ll also get access to my Trading Challenge chat room with access to my millionaire and six-figure students. And also weekly webinars with me and top students like Mark Crook, Tim Grittani, and Micheal Goode.
It also includes all my DVDs (except my most comprehensive guide, “How to Make Millions”. All proceeds from the sale go to charity. Get your copy here.)
How Do I Find Stocks About to Breakout?
The best tool you need to find breakout stocks is StocksToTrade. I use it every day to find the biggest percent gainers and breakout chart patterns.
I helped design the software with all the best tools for penny stock trading.
Once I have a list of percent gainers I look for my favorite chart patterns. If there’s no pattern, I keep the stock on my watchlist and check back every day for potential trades.
You need to be prepared when the perfect trade comes along. Don’t waste your mental capital getting frustrated with the wrong setups. Be ready to strike when a breakout with the right catalyst presents itself.
To help you prepare for the right setups, I created my “Trader Checklist Part Deux” DVD. I go over the indicators you should consider before any trade. It’ll help you choose only the best trades.
3 Breakout Stock Trading Strategies Used by Professionals

Here are a few strategies you can use to trade breakout stocks…
Buy the Breakout
One trading strategy for buying breakout stocks is to buy the stock as soon as it breaks above the resistance level. This can be a bit riskier … You don’t know which breakouts will work and which will fail.
If you opt for this, cut your losses quickly and keep your losses small.
Buy the Retest of the Breakout
Another strategy for buying breakout stocks is to wait for the retest. After the stock breaks through resistance it will usually dip and retest the breakout level. If it can hold and looks to be turning back up, you can buy in.
This can be a safer strategy if you want to wait for confirmation that the breakout will hold.
Looking to build smarter trading strategies? Start my 30-Day Bootcamp today. It’s ridiculously low-priced and can help you build a solid trading foundation. And you don’t have to do it in 30 days … You can move as fast or slow as you need. Get in now!

Wait for Consolidation
If you miss buying a breakout and a retest of the breakout level, you can wait a few days for a secondary move. Breakouts can be more powerful after a few days or even months after a high is made.
That’s because, after a big move, more and more short sellers pile in, using the previous high as their risk. After a few days of the stock staying under the high, the shorts will gain confidence. But once the stock spikes up, the shorts are wrong and have to buy to cover.
They join the other traders buying in on the trend, and that can create a BIG short squeeze.


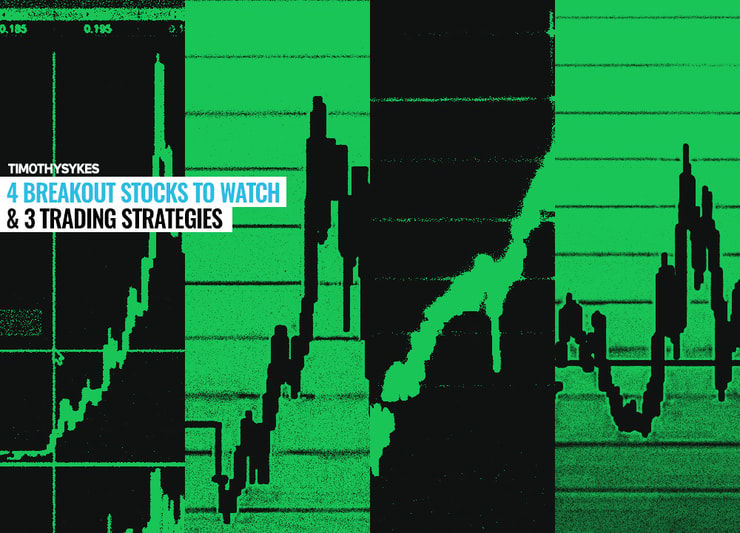
4 Top Breakout Stocks to Watch in 2020
Here I’ll share with you some breakout stocks that have recently made moves. You can see that not all breakouts look the same or have the same strength…
Aphria Inc. (NASDAQ: APHA)
Aphria Inc. (Nasdaq: APHA) broke above the multi-day resistance level of the $4.50s and a multi-week level of the $4.75s when it had a big first green day on October 5.
You can see the volume on the breakout day was higher than any day over the last two months. The breakout wasn’t based on any news, but the stock still gained momentum.
It led to another breakout over the multi-month high of $6.15 on October 12. Maybe the trend could’ve continued if the company didn’t announce disappointing earnings a few days later…

Livent Corporation (NYSE: LTHM)
Livent Corporation (NYSE: LTHM) is part of the electric vehicle sector that’s been hot. It manufactures and sells high-performance lithium batteries. The stock has been in an uptrend for the last four months.
On October 5, it opened above the breakout level of the $9.80 area. That day it climbed almost $1 per share. Over the next few days, it climbed to the next resistance area of $12.50. It was rejected and has now come down to retest the breakout area around $10.
Stocks with news or in hot sectors have the greatest potential to go supernova.

Enzolytics, Inc. (OTCPK: ENZC)
I bought Enzolytics, Inc. (OTCPK: ENZO) on October 5, when it had a huge breakout over its previous high of around $0.0095. Since I bought a bit late on the daily chart breakout, I waited for an opportunity. I bought it when it broke its intraday high in the afternoon.
I bought 747,000 shares at $0.012. Since it was already up a lot on the day, I sold pretty quickly at $0.0135 for a profit of $1,120.* You can see the following day it had another huge gain.
It’s now come back down to retest the breakout level.

Westwater Resources, Inc. (NASDAQ: WWR)
I bought this breakout stock on October 2. My position was 5,000 shares that I bought at $4.08 and sold at $4.23 for a profit of $750.* I ended up trading this stock more than once when the momentum continued.
I rebought 8,000 shares on a dip at $4.59 and sold at $4.72 for a profit of $1,040.* And I took a third quick trade on it, taking 6,000 shares from $4.70 to $4.79 for a profit of $540.* I was having broker issues throughout the day, so I took quick profits to stay safe.
As you can see from the chart, the stock made new highs again over the next two days. This is why it’s so important to watch former runners. Also, look at the volume the stock traded on the breakout days — unreal.
And in true penny stock fashion, the stock completely failed and is now trading back where it started.

(*Please note that these kinds of trading results are not typical. Most traders lose money. It takes years of dedication, hard work, and discipline to learn how to trade, and individual results will vary. Trading is inherently risky. Before making any trades, remember to do your due diligence and never risk more than you can afford to lose.)
The Bottom Line on Breakout Stocks
Breakouts can be an easy chart pattern for newbies to recognize. They can also provide a good trading opportunity to ride big upside momentum.
But they don’t always work. So you must be ready to cut losses quickly if the trade isn’t working. You don’t always have to wait for a trade to be a loss before cutting it. If it looks like a lot of sellers are pushing the stock down — get out.
I have over 20 years of experience in the market. So I’ve learned what I want out of a trade. And when I don’t like what a stock’s doing, I cut losses or take a small win and move on. I wait for the best setups and I trade overly safe. Protecting your account is crucial.

I started teaching to help others reach financial freedom and cut loose from the 9-to-5. Being able to work from virtually anywhere, with only a laptop and Wi-Fi is truly life-changing. Follow your dreams and join me in the Trading Challenge.
Do you buy breakout stocks? Let me know in the comments — I love to hear from you!

Leave a reply