
Tidewater Inc. stocks have been trading up by 8.2 percent amid heightened investor optimism from the most recent bullish coverage.
Market Insights For Active TDW Traders
- Weekly chart shows Tidewater Inc. breaking higher from the upper $70s into the mid-$80s, signaling fresh momentum.
- Intraday range from roughly $79.50 to $86.35 highlights strong buying pressure and elevated volatility.
- Profit margins above 18% and revenue growth above 19% support the recent strength in TDW.
- Solid balance sheet with low debt and high liquidity gives the trend more staying power.
- Traders are watching whether TDW can hold above the $80 area as a new support zone.
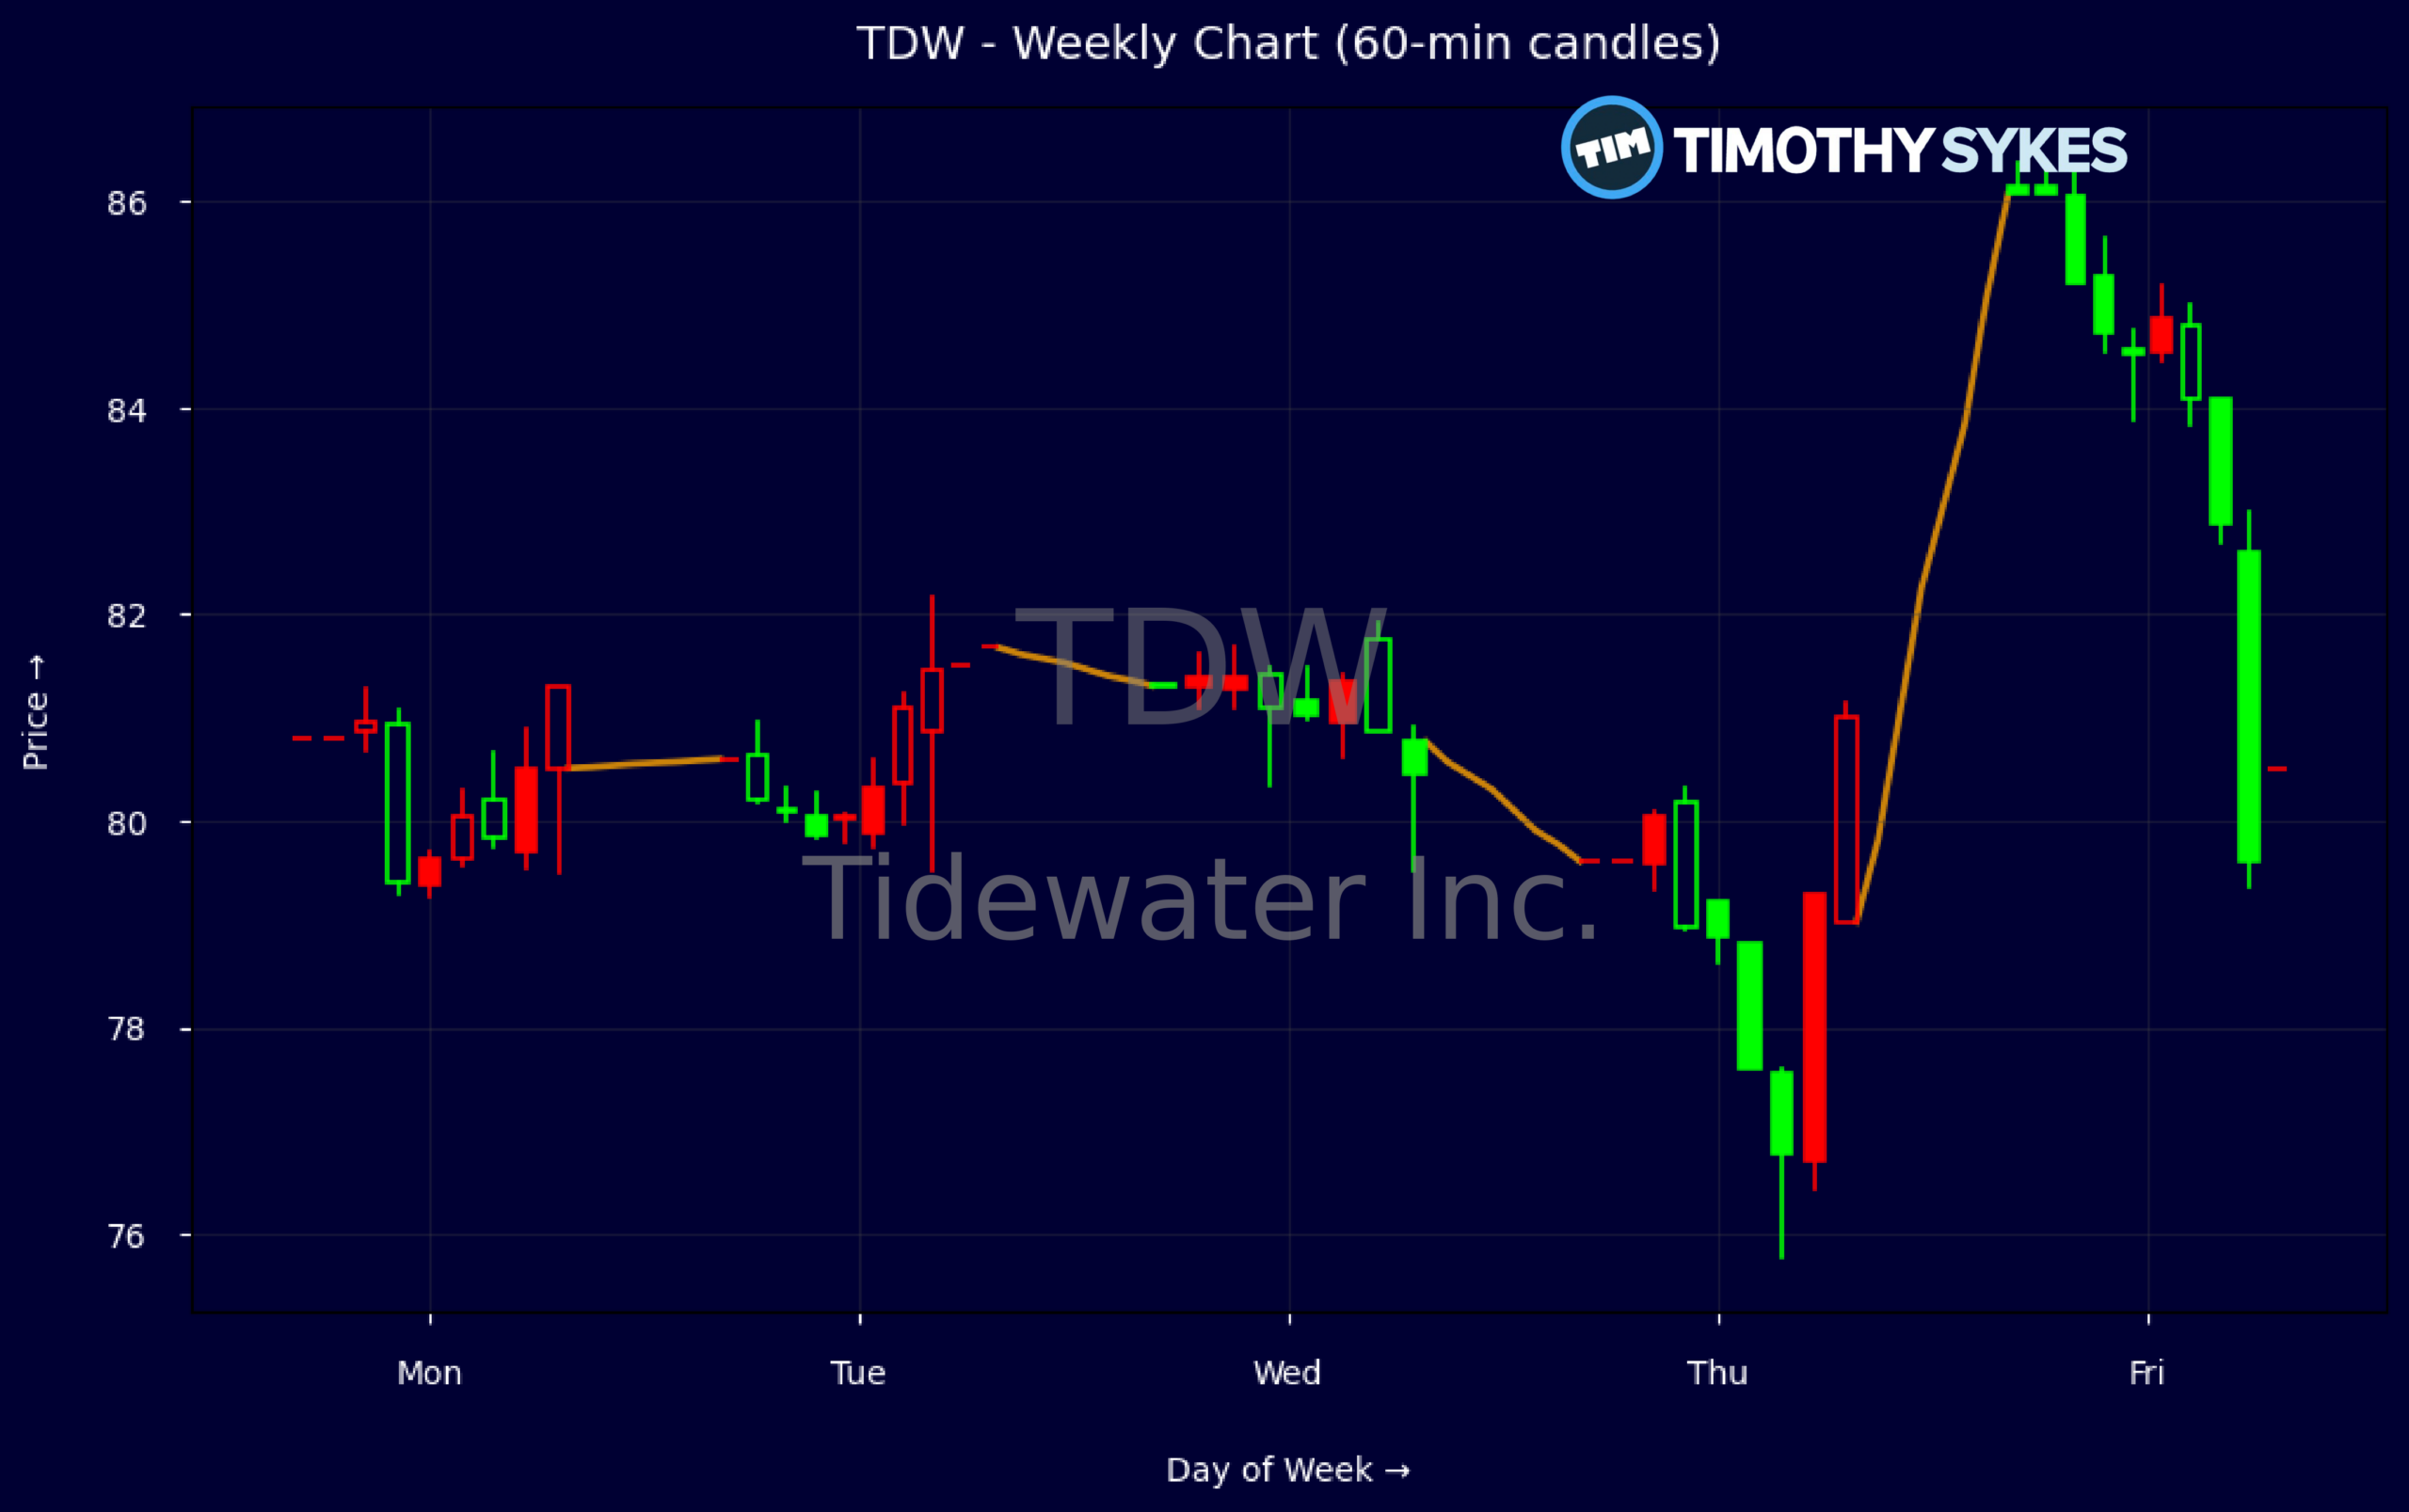
Weekly Update Oct 19 – Oct 23, 2026: On Saturday, October 24, 2026 Tidewater Inc. stock [NYSE: TDW] is trending up by 8.2%! Discover the key drivers behind this movement as well as our expert analysis in the detailed breakdown below.
Energy industry expert:
Analyst sentiment – positive
Tidewater (TDW) is a leading global offshore support vessel (OSV) operator, positioned as a high‑beta play on offshore activity. Fundamentals have pivoted from recovery to expansion: revenue is compounding at ~20% 3‑yr and ~31% 5‑yr, with EBITDA margin of 16.3% and EBIT margin of 4.8% still mid‑cycle for an upturn. ROE at ~19% LTM with modest 0.47x debt/equity and 3.6x current ratio signal a strong balance sheet. A 17.4x P/E and 3.2x sales are reasonable for this phase.
Technically, TDW shows a strong upward bias: the week pushed from roughly 80.6 to 86.1, with higher highs and higher lows and no real evidence of supply capping the move. Recent 5‑minute candles (intraday) show buyers absorbing dips near 80–82 with expanding volume on up‑swings, confirming institutional interest. The dominant trend is bullish. A concrete trading level is 82: buy pullbacks toward 82 with a tight stop below 79.5, targeting a retest and extension of recent highs.
With no material recent news, the main driver remains cycle leverage versus Energy and Fossil Fuels benchmarks, where TDW offers superior growth and operating torque at the cost of higher cyclicality. Versus integrated oils, it is earlier in the earnings expansion curve. Support is now 80–82, with secondary support at 75; near‑term resistance sits around 90. I expect TDW to outperform sector benchmarks over 12–18 months, with a reasonable upside target band of 95–105.
More Breaking News
Quick Financial Overview
Tidewater Inc. (TDW) is printing strong momentum on the chart. The weekly data shows price pinned around $80 early in the week, dipping to $79.61, then driving to a high above $86 and closing near $86.14. That kind of expansion in range and firm close near the highs is classic trend-continuation behavior, and traders will treat the $79–$80 area as an important pivot going forward.
The intraday 5-minute snapshot backs this up. TDW traded from about $79.61 up to $86.35 in a single session, with the close holding near the upper end of that range. That points to aggressive demand and short-term breakout energy rather than a weak spike. For short-term traders, this type of wide yet controlled range is attractive, but it does demand tight risk control.
Under the hood, the fundamentals support the price strength. Tidewater Inc. generated roughly $1.35B in revenue with profit margins around 18%, and an EBIT margin near 4.8%, indicating a business that is solidly profitable. A P/E near 17.4 and price-to-sales around 3.2 suggest the stock is not cheap, but not extreme given double-digit revenue growth over 3 and 5 years. Balance sheet metrics stand out: current ratio around 3.6, quick ratio 3.4, and total debt-to-equity at 0.47 show ample liquidity and moderate leverage, which is key for a cyclical marine services name.
Conclusion
This is stock news, not investment advice. Timothy Sykes News delivers real-time stock market news focused on key catalysts driving short-term price movements. Our content is tailored for active traders and investors seeking to capitalize on rapid price fluctuations, particularly in volatile sectors like penny stocks. Readers come to us for detailed coverage on earnings reports, mergers, FDA approvals, new contracts, and unusual trading volumes that can trigger significant short-term price action. Some users utilize our news to explain sudden stock movements, while others rely on it for diligent research into potential investment opportunities.
Dive deeper into the world of trading with Timothy Sykes, renowned for his expertise in penny stocks. Explore his top picks and discover the strategies that have propelled him to success with these articles:
- Penny Stocks Trading Guide
- Best Penny Stocks Under $1 to Buy Today
- Top 8 Penny Stocks to Watch on Robinhood
Once you’ve got some stocks on watch, elevate your trading game with StocksToTrade the ultimate platform for traders. With specialized tools for swing and day trading, StocksToTrade will guide you through the market’s twists and turns.
Dig into StocksToTrade’s watchlists here:



Leave a reply