
Founder Group Limited faces heightened downside risk as restructuring-driven uncertainty intensifies while stocks have been trading down by -42.51 percent.
Market Insights For Active Traders
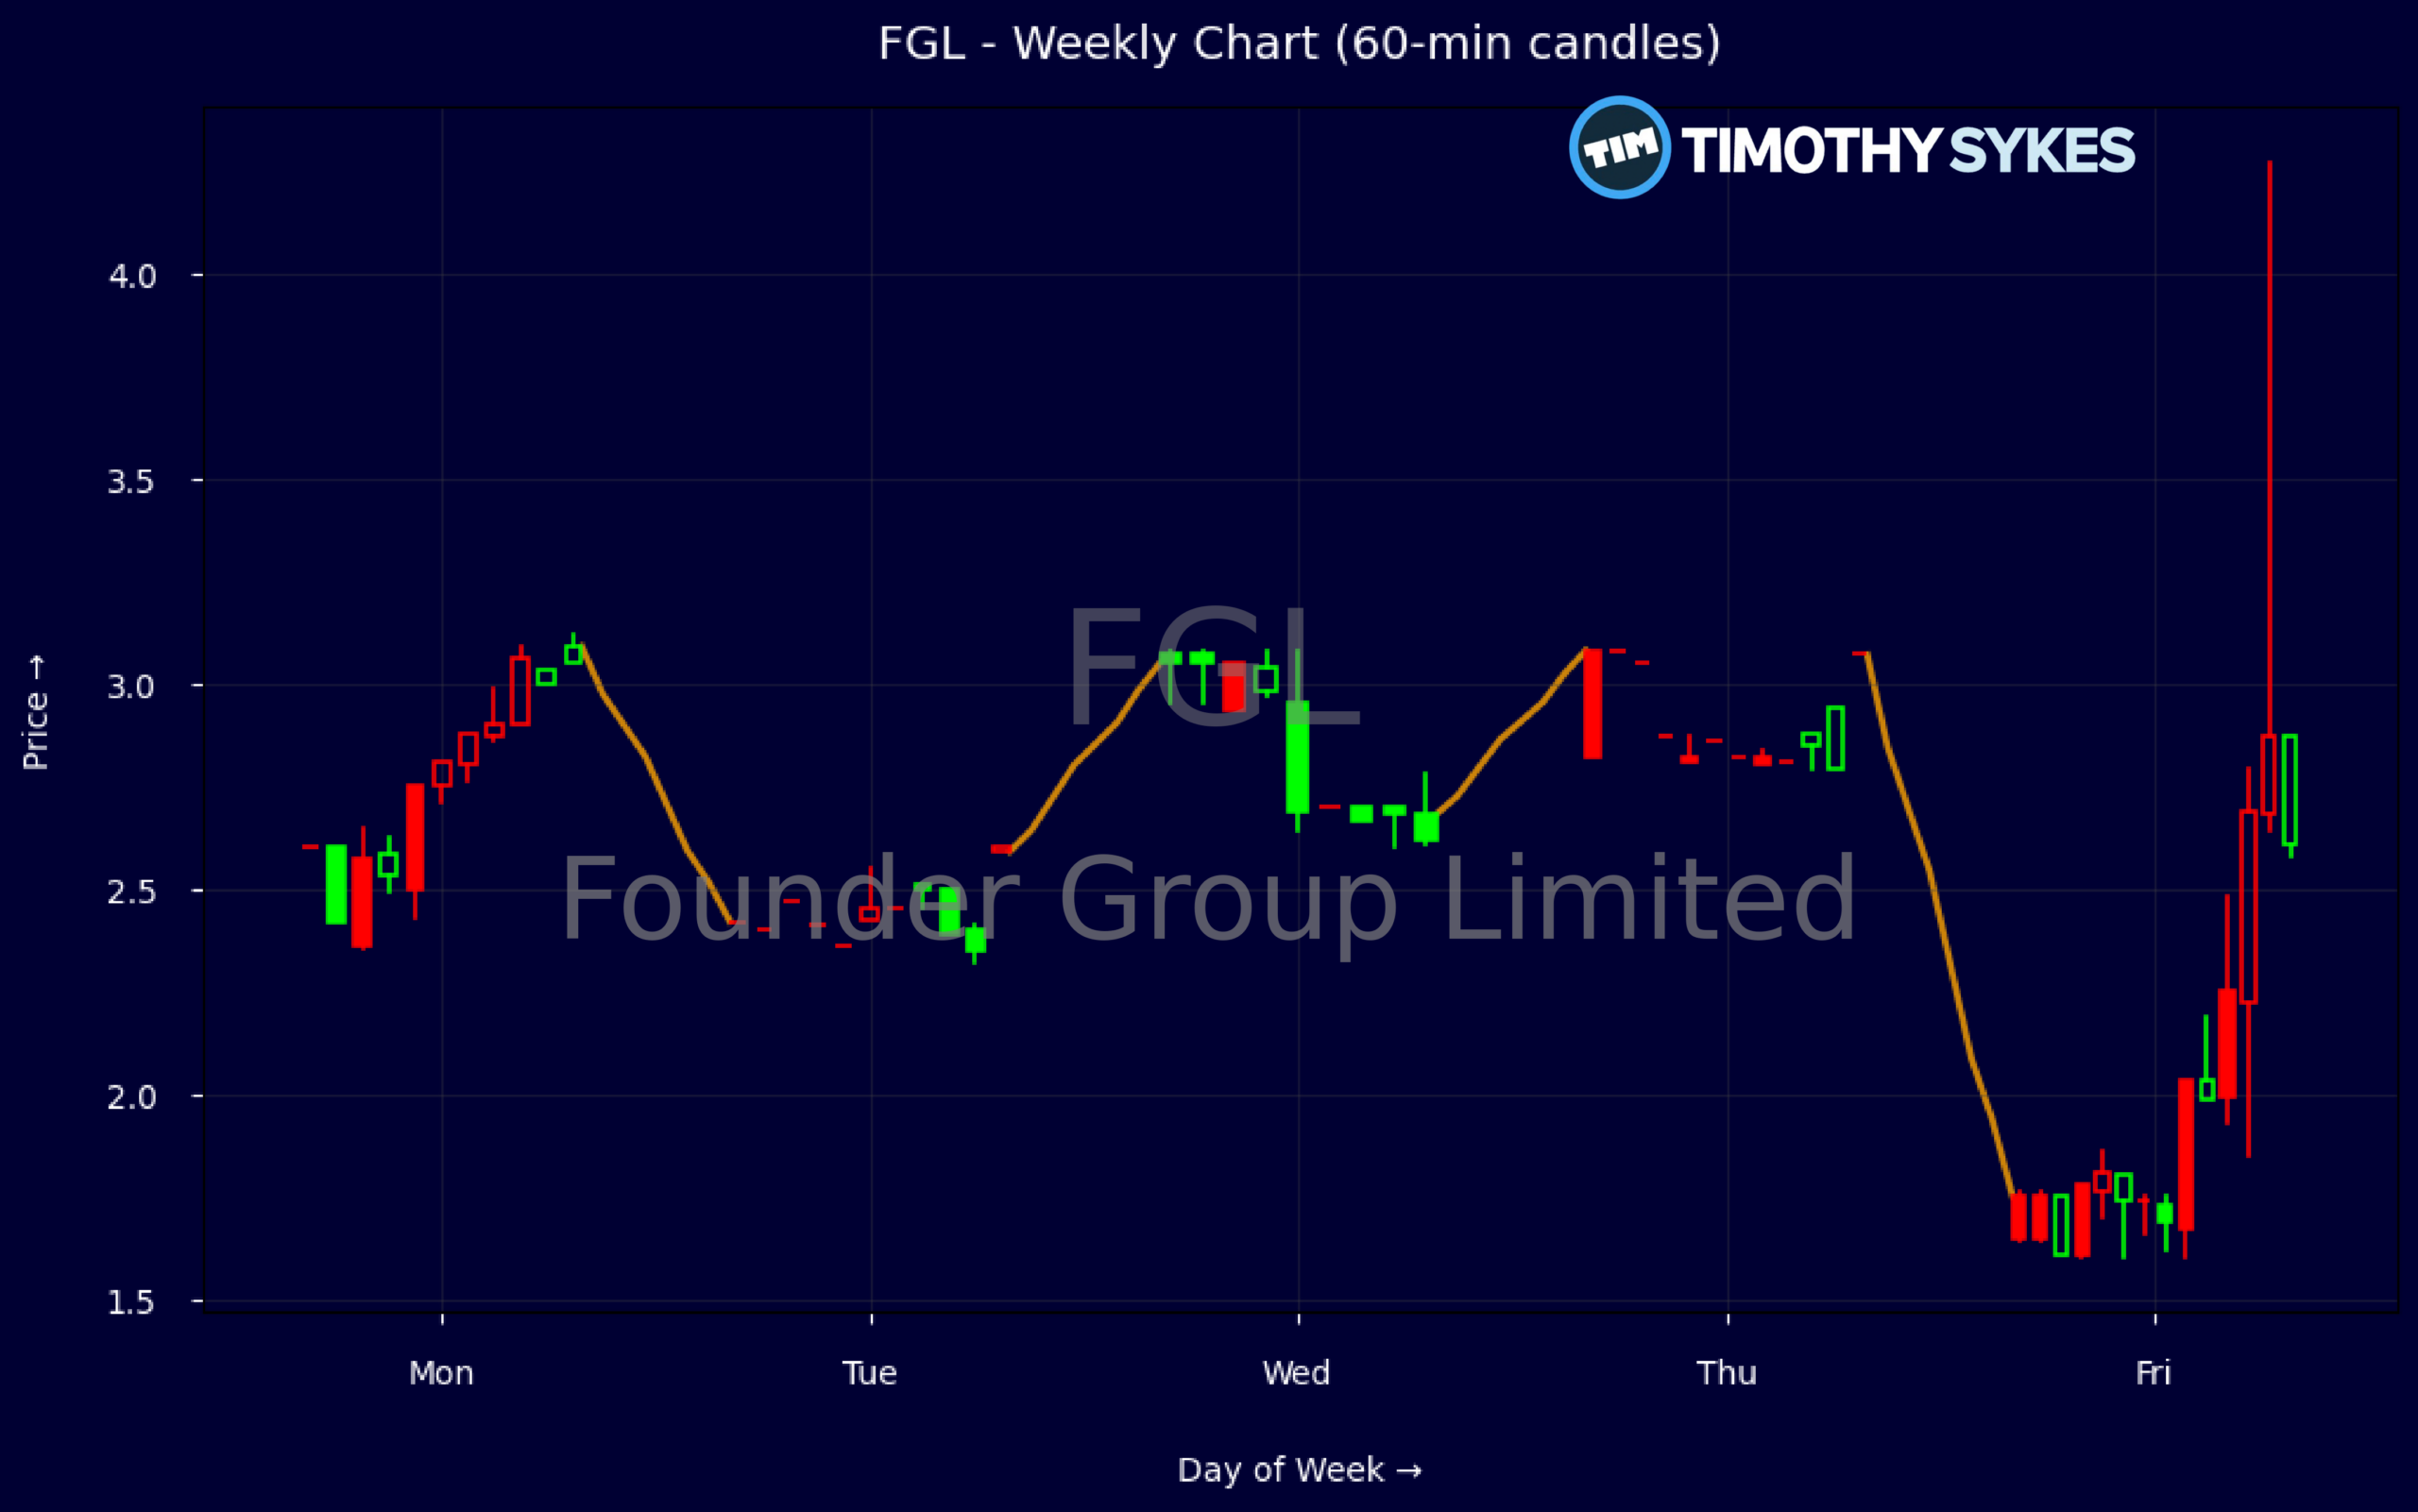
- Weekly chart shows a spike to above 3.00 followed by a collapse toward 1.65, signaling heavy supply hitting recent strength.
- Intraday action from 2.60 down to 1.81 in one session highlights real-time selling pressure and high volatility for Founder Group Limited.
- Valuation for FGL looks low versus sales and book value, but weak returns on capital keep conviction cautious.
- Balance sheet shows strong cash and working capital, giving FGL room to navigate while traders focus on price structure.
Weekly Update Oct 19 – Oct 23, 2026: On Saturday, October 24, 2026 Founder Group Limited stock [NASDAQ: FGL] is trending down by -42.51%! Discover the key drivers behind this movement as well as our expert analysis in the detailed breakdown below.
Energy industry expert:
Analyst sentiment – neutral
FGL operates as a small-cap, deep-value energy name trading at only 0.13x sales and 0.92x book (BVPS $20.61), indicating the market is pricing in material risk but not distress. Revenue of ~$121m on assets of ~$190m highlights capital intensity with weak profitability (ROIC -0.52%, ROA ~0%, effectively zero retained earnings). Leverage is elevated (leverage ratio 6.3; long-term debt ~$17.5m vs equity ~$30.3m) but supported by a strong cash position (~$80m, >40% of assets), providing liquidity and optionality.
Technically, FGL has shifted from a short-term breakout to a sharp corrective phase. Price lifted from 2.42 to a 3.05–3.08 range, then reversed aggressively to close at 1.65 on heavy volume, signaling decisive supply and likely stop-driven selling. The dominant trend on the weekly view is now bearish with momentum overshoot. The key actionable level is resistance at 2.40–2.60; rallies into that band are sells with tight risk control, while cautious buyers wait for a multi-session base above 1.60.
With no fresh company-specific news, FGL trades primarily on balance-sheet value and sector sentiment. Versus broader Energy and Renewable Energy Producers benchmarks, it is significantly cheaper but also structurally weaker on returns and scale, justifying a discount but not a collapse scenario given cash coverage. Base case is range trade with a 3–6 month fair value band of 2.20–2.70, support at 1.50 and resistance at 2.60–2.80. Bias is accumulation only below 2.00 by risk-tolerant investors.
More Breaking News
Quick Financial Overview
Founder Group Limited (FGL) is trading like a deep-value name with a broken chart. On the valuation side, FGL posts revenue of about $120.7M, with a price-to-sales ratio near 0.13, suggesting the market is assigning a steep discount to current sales. The price-to-book ratio around 0.92, against a book value per share of 20.61, also implies the stock trades slightly below its accounting equity value, a setup value-focused traders often track.
The balance sheet gives more context. Total assets stand near $189.7M, with cash and cash equivalents around $80.2M, meaning a large chunk of the asset base is in cash. Current assets of roughly $163.4M versus current liabilities of about $141.5M leave positive working capital near $21.9M, which helps support operations even if conditions stay weak. A leverage ratio of 6.3 and long-term debt of about $17.5M against equity of roughly $30.3M point to a geared, but not extreme, capital structure.
From a trading view, the chart is the real story right now for FGL. Weekly data show a move from 2.47 down toward 1.65 after briefly spiking above 3.00, a classic failed breakout pattern that traps late buyers. The intraday 5-minute bar collapsing from 2.60 to a 1.60 low and closing at 1.81 underscores aggressive selling, likely from short-term traders bailing and liquidity thinning out. Combined with weak recent return metrics, such as a negative 1-year return on invested capital near -0.52, traders should treat bounces carefully until the stock proves it can hold higher lows.
Conclusion
This is stock news, not investment advice. Timothy Sykes News delivers real-time stock market news focused on key catalysts driving short-term price movements. Our content is tailored for active traders and investors seeking to capitalize on rapid price fluctuations, particularly in volatile sectors like penny stocks. Readers come to us for detailed coverage on earnings reports, mergers, FDA approvals, new contracts, and unusual trading volumes that can trigger significant short-term price action. Some users utilize our news to explain sudden stock movements, while others rely on it for diligent research into potential investment opportunities.
Dive deeper into the world of trading with Timothy Sykes, renowned for his expertise in penny stocks. Explore his top picks and discover the strategies that have propelled him to success with these articles:
- Penny Stocks Trading Guide
- Best Penny Stocks Under $1 to Buy Today
- Top 8 Penny Stocks to Watch on Robinhood
Once you’ve got some stocks on watch, elevate your trading game with StocksToTrade the ultimate platform for traders. With specialized tools for swing and day trading, StocksToTrade will guide you through the market’s twists and turns.
Dig into StocksToTrade’s watchlists here:





Leave a reply