

Maplebear Inc. stocks have been trading up by 9.22 percent amid strong Instacart growth and bullish consumer-demand outlook.
What Traders Need To Know
- Reports say Instacart is exploring a sale with bankers, talking to Uber and DoorDash at a rumored $16–17B value, implying a rich 30%–40% premium.
- Shares spiked roughly 7%–9% on the takeover buzz, with CART recently trading near $55.98 after the headlines.
- Wells Fargo lifted its price target to $56, citing stronger Q3/Q4 transaction trends and benefits from the Gopuff partnership and smaller-basket focus.
- A Big Y Foods deal expands Instacart’s FoodStorm tech and in‑store kiosks across 79 locations, signaling deeper grocery‑tech integration.
- A $5M DOJ/EEOC discrimination settlement adds some governance risk, though it is small versus Instacart’s potential multi‑billion valuation.
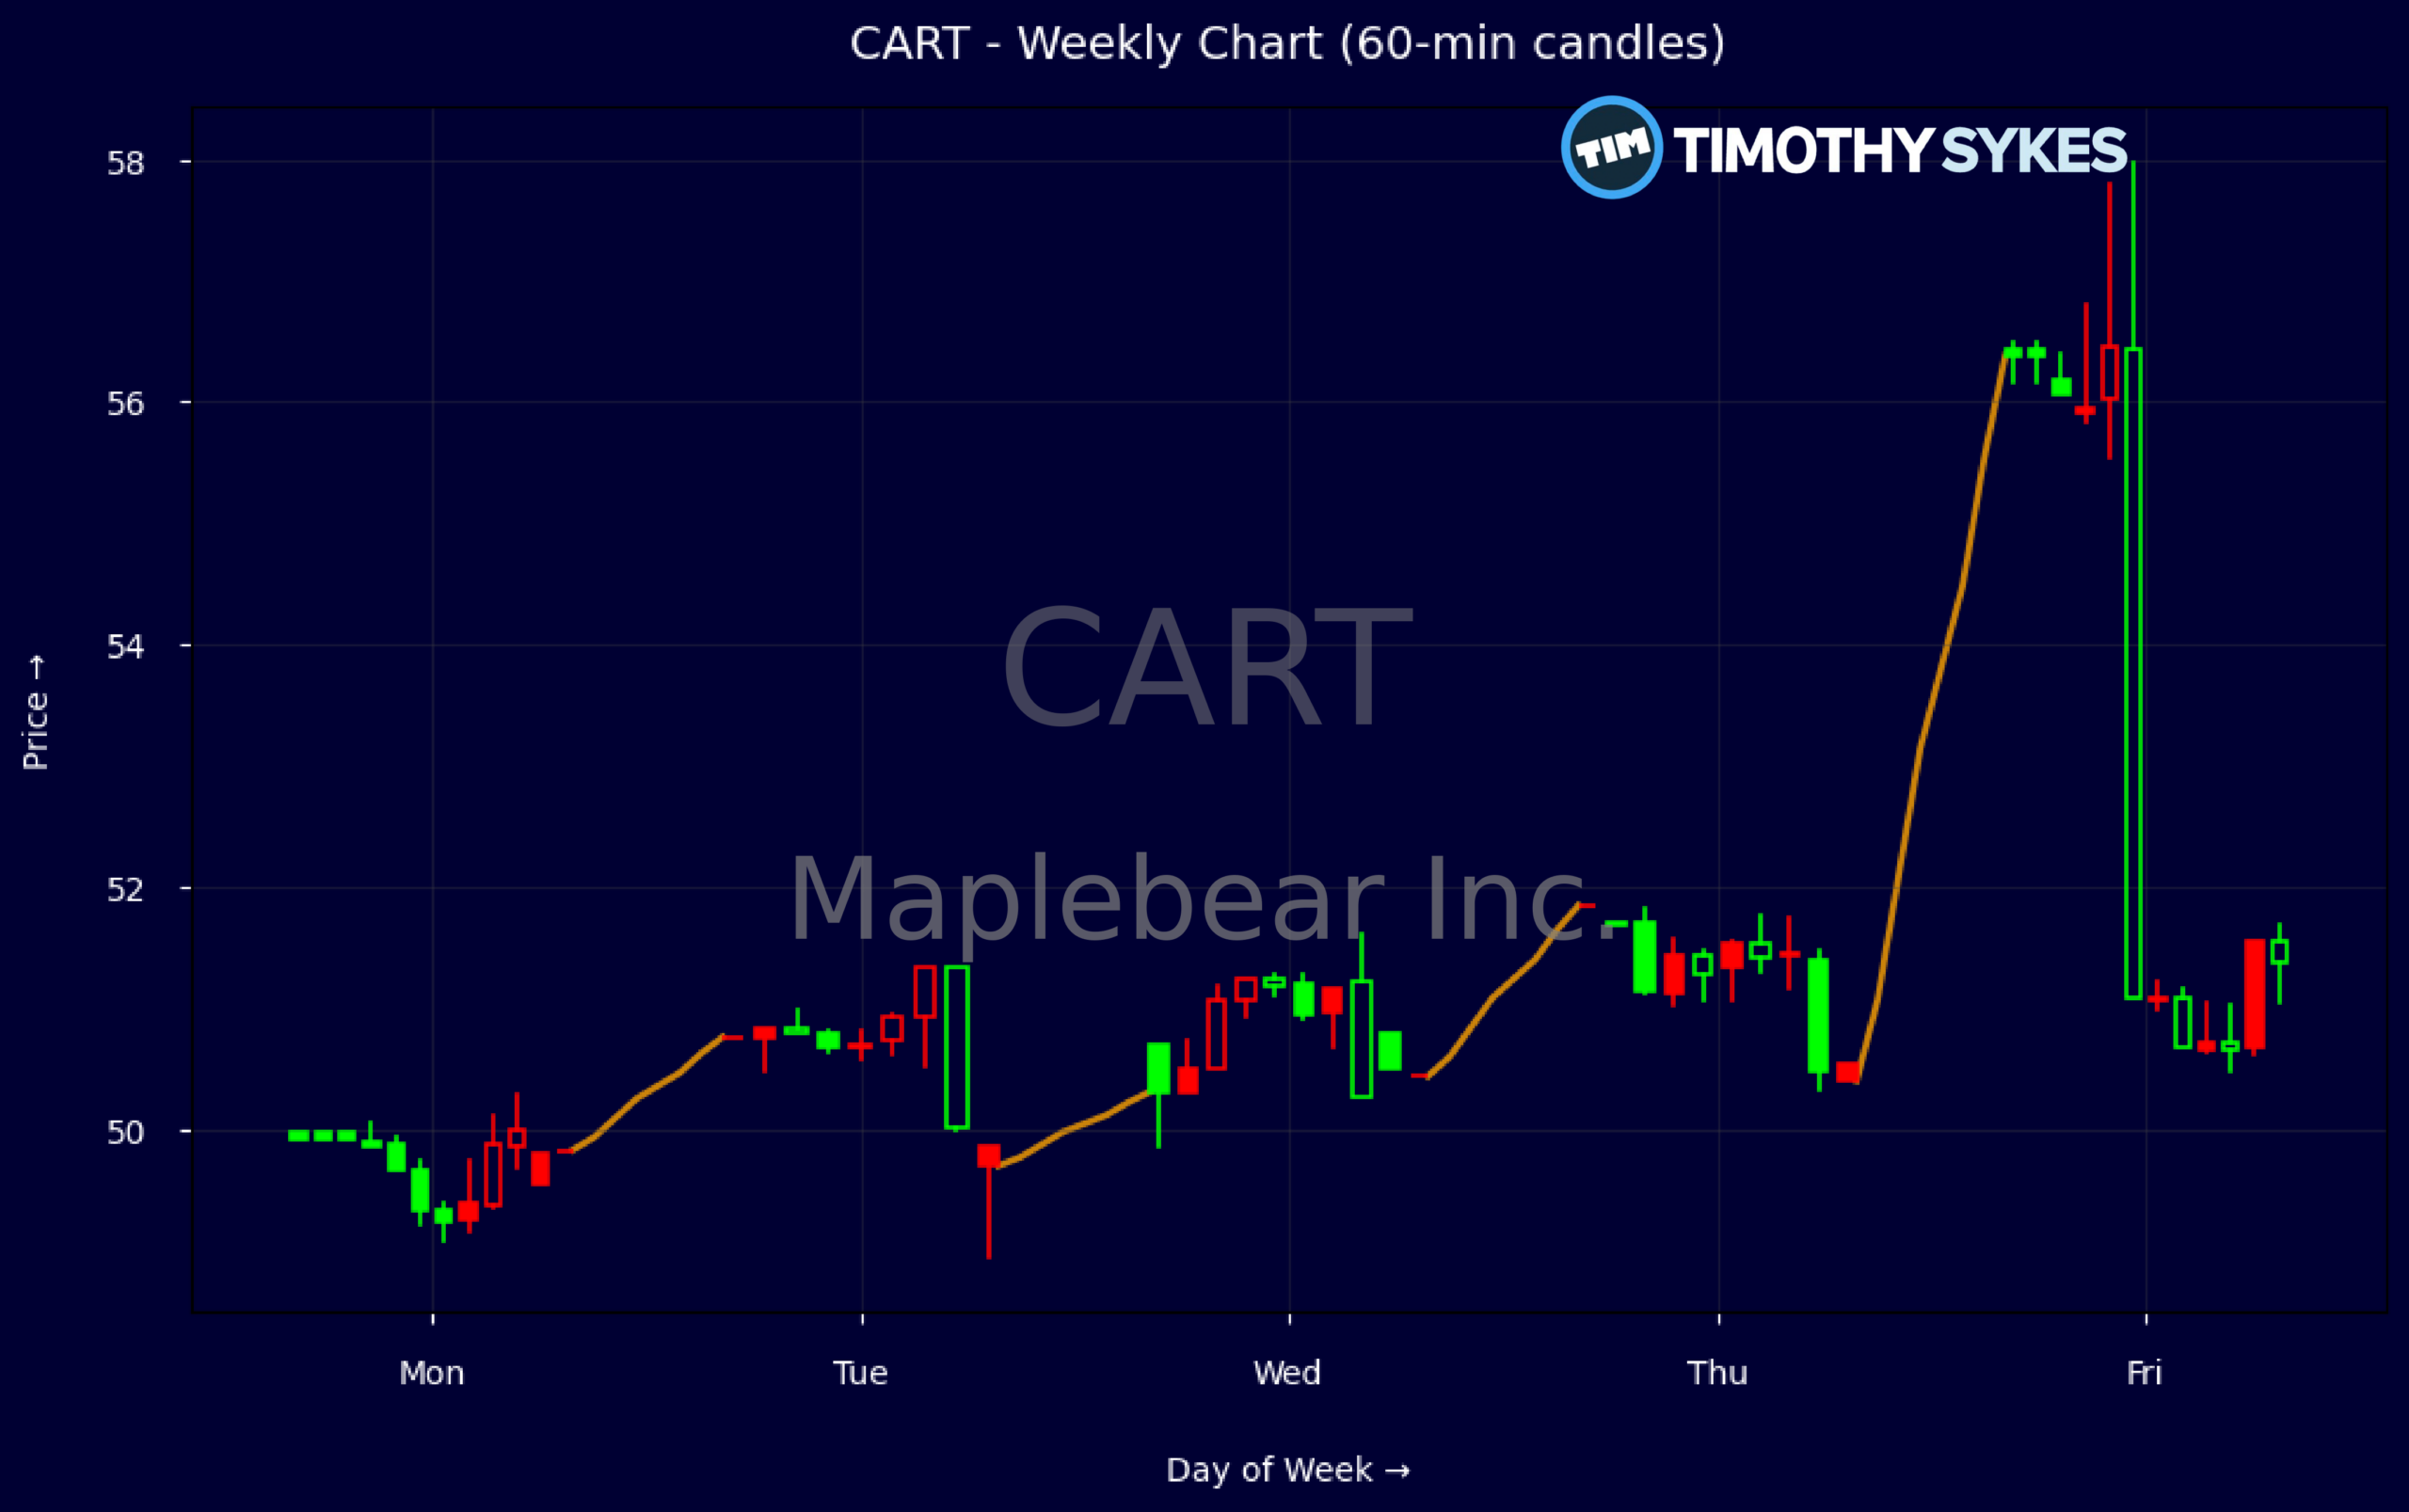
Weekly Update Oct 19 – Oct 23, 2026: On Saturday, October 24, 2026 Maplebear Inc. stock [NASDAQ: CART] is trending up by 9.22%! Discover the key drivers behind this movement as well as our expert analysis in the detailed breakdown below.
Consumer Discretionary industry expert:
Analyst sentiment – positive
Instacart (CART) now occupies a strong, asset‑light position in online grocery and convenience, combining 39% three‑year revenue CAGR with a 72.6% gross margin and mid‑teens EBIT/EBITDA margins, ahead of most Consumer Discretionary peers. Cash conversion is excellent: Q2 operating cash flow of $494M and FCF of $481M versus a ~$12.6B enterprise value implies an attractive ~5.9x P/FCF. The balance sheet is pristine (net cash, debt/equity ~0.01, current ratio 2.3), enabling sizable buybacks without stressing liquidity.
Technically, the weekly tape shows a powerful breakout: shares moved from ~50 to a 56.46 high, closing 56.45 after a news‑driven spike, confirming a new short‑term uptrend. Five‑minute candles indicate heavy upside volume on the $55–$57 range, with buyers absorbing supply into the close rather than a reversal wick. The key actionable level is support at $52–$53 (prior resistance zone); as long as price holds above $52 on a closing basis, the long bias remains intact.
The reported strategic‑review/sale process, with preliminary talks involving Uber and DoorDash and a floated $16–17B valuation, is a major upside catalyst versus the current EV, implying a 30–40% premium and creating a de facto floor near the mid‑50s. Operationally, FoodStorm expansion and stronger GTV trends keep Instacart ahead of most Retail‑Discretionary names on growth and profitability. I assign a decisive Positive rating with near‑term resistance at $60 and support at $52; fair value is $62.
More Breaking News
Quick Financial Overview
Maplebear Inc. (CART), better known as Instacart, is trading with fresh momentum after the sale headlines and follow‑through buying. Weekly data show a strong push from the low $50s to a high near $57.79, with the latest weekly close around $56.45, confirming buyers in control. The intraday 5‑minute bar that ran from an open near $51.37 to a high of $57.98 before closing at $56.44 shows a classic news‑driven squeeze: wide range, heavy upside extension, and only a modest giveback into the close.
Underneath that tape, CART’s fundamentals are relatively solid for a high‑growth platform. Revenue runs around $3.742B, with gross margin at 72.6%, and profit margin near 11%–12%, which is healthy for a logistics‑driven marketplace. Profitability ratios show an EBIT margin of 13% and EBITDA margin near 15.9%. Return on equity on a trailing basis is in the mid‑teens, and return on assets is over 11% LTM, pointing to efficient use of the asset base.
Valuation is not dirt‑cheap but not extreme for a profitable growth name. The P/E is about 25.96, with price‑to‑sales at 2.84 and price‑to‑free‑cash near 5.9, backed by roughly $481M in quarterly free cash flow. The balance sheet is clean: total debt‑to‑equity is around 0.01, current ratio about 2.3, and cash plus short‑term investments near $850M against total liabilities of about $1.187B. For traders, that low leverage and strong liquidity matter if sale talks stall and the stock has to trade back on pure fundamentals.
Conclusion
This is stock news, not investment advice. Timothy Sykes News delivers real-time stock market news focused on key catalysts driving short-term price movements. Our content is tailored for active traders and investors seeking to capitalize on rapid price fluctuations, particularly in volatile sectors like penny stocks. Readers come to us for detailed coverage on earnings reports, mergers, FDA approvals, new contracts, and unusual trading volumes that can trigger significant short-term price action. Some users utilize our news to explain sudden stock movements, while others rely on it for diligent research into potential investment opportunities.
Dive deeper into the world of trading with Timothy Sykes, renowned for his expertise in penny stocks. Explore his top picks and discover the strategies that have propelled him to success with these articles:
- Penny Stocks Trading Guide
- Best Penny Stocks Under $1 to Buy Today
- Top 8 Penny Stocks to Watch on Robinhood
Once you’ve got some stocks on watch, elevate your trading game with StocksToTrade the ultimate platform for traders. With specialized tools for swing and day trading, StocksToTrade will guide you through the market’s twists and turns.
Dig into StocksToTrade’s watchlists here:





Leave a reply