
Companhia de Saneamento Básico do Estado de São Paulo – Sabesp stocks have been trading up by 8.45 percent after major privatization progress
Market Insights For SBS Traders
- Recent weekly candles show Companhia de saneamento Basico Do Estado De Sao Paulo – Sabesp grinding higher from $6.23 to $6.80, pointing to steady upside momentum.
- Intraday action around $6.40 shows tight ranges, hinting at accumulation rather than panic selling.
- Profit margin near mid-teens and a price-to-earnings ratio just under 14 suggest SBS is priced reasonably against its earnings power.
- Balance sheet shows meaningful long-term debt, so leverage remains a key risk to watch.
- Dividend yield above 0.5% signals ongoing cash returns, even as revenue trends look flat to down.
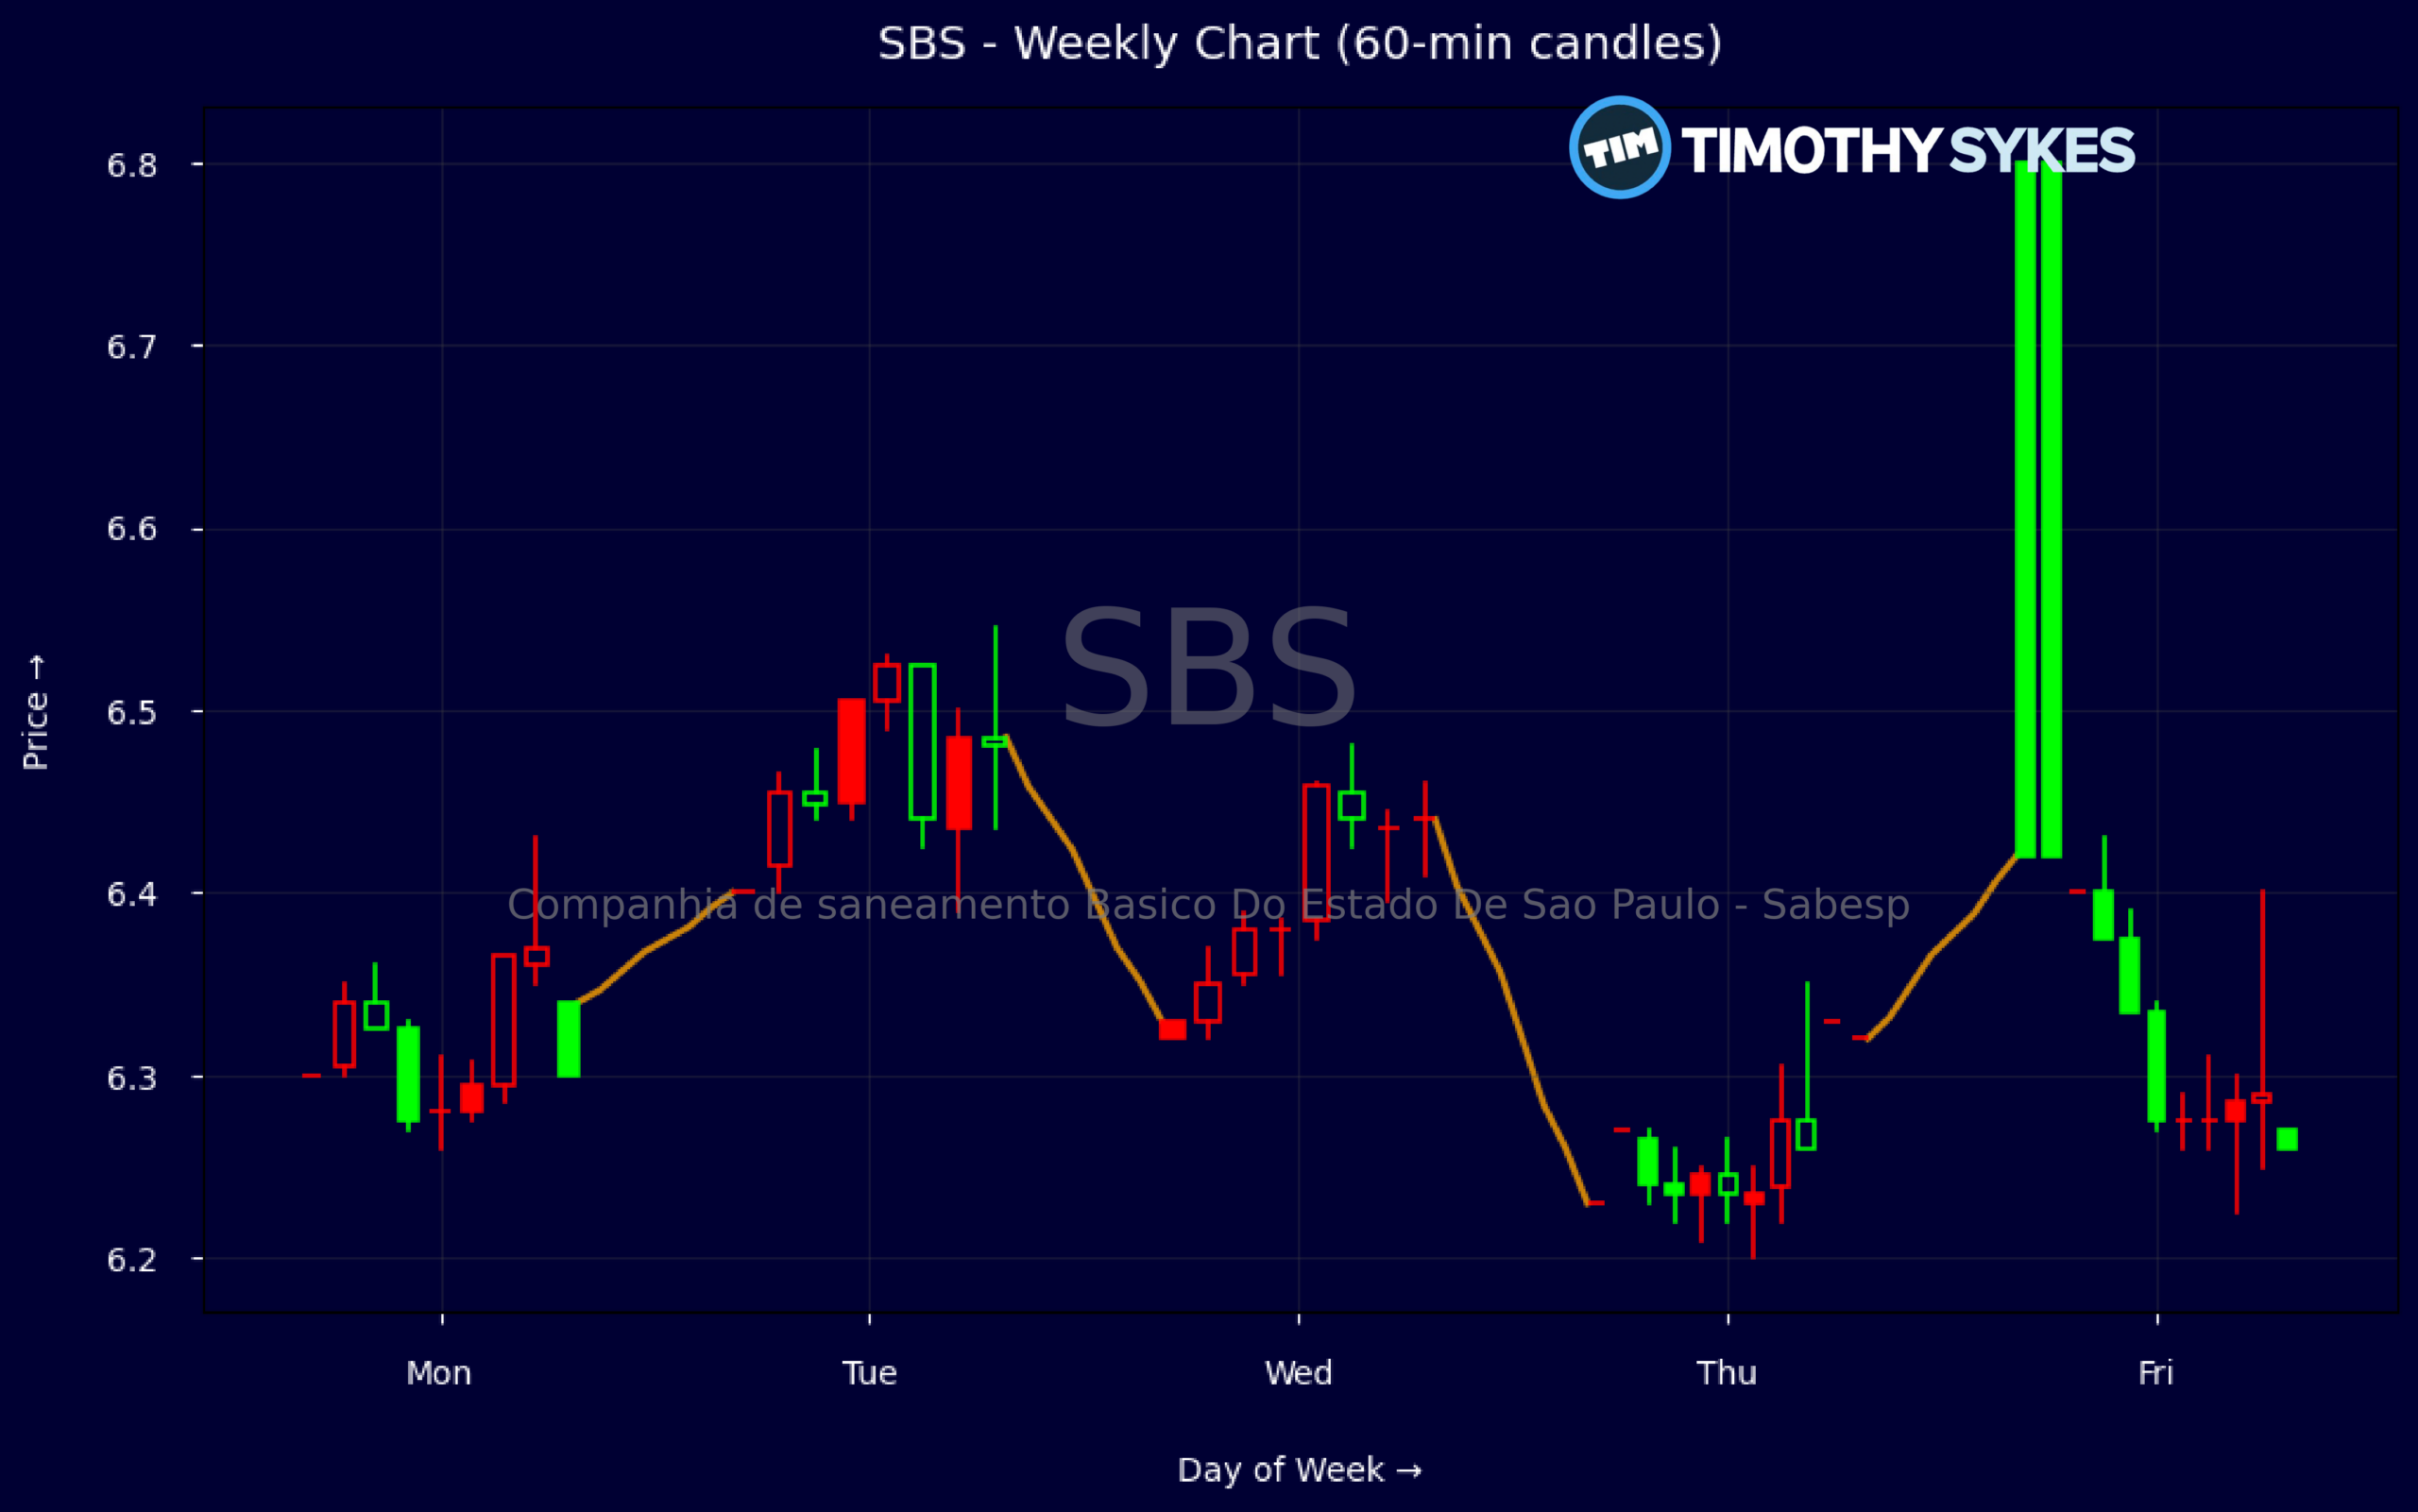
Weekly Update Oct 19 – Oct 23, 2026: On Saturday, October 24, 2026 Companhia de saneamento Basico Do Estado De Sao Paulo – Sabesp stock [NYSE: SBS] is trending up by 8.45%! Discover the key drivers behind this movement as well as our expert analysis in the detailed breakdown below.
Utilities industry expert:
Analyst sentiment – neutral
Companhia de Saneamento Básico do Estado de São Paulo (SBS) is a scale leader in Brazilian regulated water and sewage, with solid but not outstanding profitability for the risk profile. A pre‑tax margin of 14.7% and ROIC of 11.7% on a highly capital‑intensive base are respectable, though ROE of 3.2% highlights balance‑sheet drag from heavy intangibles (goodwill/intangibles ~55% of assets). Valuation at ~14x earnings and 3.2x sales looks full relative to low growth and regulatory constraints.
Technically, SBS is breaking from a tight consolidation, with the weekly range 6.23–6.80 and a sharp push to close at the highs (6.80) after several flat sessions. That pattern, plus intraday 5‑minute candles showing persistent buying on upticks and better volume on green bars, confirms emerging upside momentum. The key actionable level is 6.40: above it, bias stays long with initial resistance at 7.00; a sustained break back below 6.40 invalidates the short‑term bullish setup.
With no material news catalysts, direction will hinge on regulatory decisions in São Paulo, tariff resets, and Brazil macro (rates and FX). Versus global Utilities and Regulated Utilities indices, SBS offers higher regulatory and political risk, modestly lower profitability, but better potential operating leverage if capex efficiency improves. I view risk‑reward as balanced at current levels: maintain a Neutral stance, with support at 6.20, resistance at 7.20, and a 6–12 month fair‑value band centered near 7.00.
More Breaking News
Quick Financial Overview
Companhia de saneamento Basico Do Estado De Sao Paulo – Sabesp sits in a classic utility-style role, and the numbers reflect that stable but leveraged profile. Revenue is about $36.1B, with pretax profit margin of 14.7%, which shows SBS can still turn a solid profit on each dollar of sales even if top-line growth is weak. The price-to-earnings ratio around 13.97 keeps the stock in a middle ground: not deep value, but not stretched growth either.
On the balance sheet, total assets of roughly $80.97B and equity near $36.93B give SBS a decent capital base, while a leverage ratio of 2.5 and long-term debt of about $22.12B underline the importance of steady cash flow. Working capital is negative, which means short-term liabilities exceed short-term assets, something traders should not ignore in periods of credit stress. Still, the presence of retained earnings above $21.64B shows the company has built up value over time.
From a price-action angle, the weekly chart for SBS shows a basing pattern between roughly $6.23 and $6.80, with the latest close at the top of that band. That kind of slow grind higher often reflects quiet accumulation. Intraday, the 5-minute data around $6.36 to $6.43, closing at $6.40, confirms a tight, controlled tape rather than wild swings, which suits mean-reversion and breakout traders who thrive on clean levels.
Conclusion
The recent behavior of Companhia de saneamento Basico Do Estado De Sao Paulo – Sabesp tells a simple story: steady margins, real leverage, and a stock pressing against short-term resistance. For traders, SBS here is less about explosive growth and more about whether this tight range resolves into a sustained push over the recent $6.80 high. The combination of a mid-teens pretax margin and a sub-14 earnings multiple suggests room for re-rating if sentiment improves, but the heavy long-term debt load means downside can open quickly if rates rise or cash flows slip.
Weekly candles holding above $6.20 keep the current constructive bias intact, while the intraday $6.30–$6.45 band acts as the active battlefield for short-term entries and exits. Range traders will focus on fading moves near the edges of that band, while breakout traders will be patient and wait for confirmation above the recent highs with volume. SBS traders should keep one eye on leverage and liquidity ratios, and the other on how price behaves near that $6.80 area. In practical terms, this means respecting risk first; as millionaire penny stock trader and teacher Tim Sykes, says, “It’s better to go home at zero than to go home in the red.” For SBS, that translates into cutting losers quickly when the range breaks against you, instead of forcing trades just to stay active.
As a trading educator looking at Companhia de saneamento Basico Do Estado De Sao Paulo – Sabesp, my view is simple: “When a stock like SBS trades in a tight range on solid margins, the edge goes to the trader who waits for the break, not the one who guesses the direction.” This lens keeps the focus on process, not prediction, which is exactly how short-term traders stay in the game.
This is stock news, not investment advice. Timothy Sykes News delivers real-time stock market news focused on key catalysts driving short-term price movements. Our content is tailored for active traders and investors seeking to capitalize on rapid price fluctuations, particularly in volatile sectors like penny stocks. Readers come to us for detailed coverage on earnings reports, mergers, FDA approvals, new contracts, and unusual trading volumes that can trigger significant short-term price action. Some users utilize our news to explain sudden stock movements, while others rely on it for diligent research into potential investment opportunities.
Dive deeper into the world of trading with Timothy Sykes, renowned for his expertise in penny stocks. Explore his top picks and discover the strategies that have propelled him to success with these articles:
- Penny Stocks Trading Guide
- Best Penny Stocks Under $1 to Buy Today
- Top 8 Penny Stocks to Watch on Robinhood
Once you’ve got some stocks on watch, elevate your trading game with StocksToTrade the ultimate platform for traders. With specialized tools for swing and day trading, StocksToTrade will guide you through the market’s twists and turns.
Dig into StocksToTrade’s watchlists here:





Leave a reply