

Rivian Automotive Inc. stocks have been trading up by 11.31 percent amid upbeat sentiment on stronger EV demand and production outlook.
Key Takeaways For RIVN Traders
- RIVN beat Q3 expectations with adjusted EPS of -$0.48 vs -$0.65 and revenue of $2.155B vs $2.0B, powered by strong demand for the R2, now its best-selling vehicle.
- Management guided FY26 adjusted EBITDA to -$1.85B to -$1.75B on 67,000–70,000 vehicle deliveries, pointing to heavy losses but rapid scale-up.
- Jefferies upgraded RIVN to Buy from Hold with a $17 price target after a 30% slide, citing strong high-end R2 demand and Rivian’s niche in the $45K–$55K EV band.
- The company is acquiring Third Dimension AI to bring AI-powered 3D simulation in-house for driver-assistance, autonomy, and future robotaxi ambitions.
- A branded commercial van spotted with Walmart+ logos hints at possible new fleet demand for Rivian, though no relationship has been confirmed.
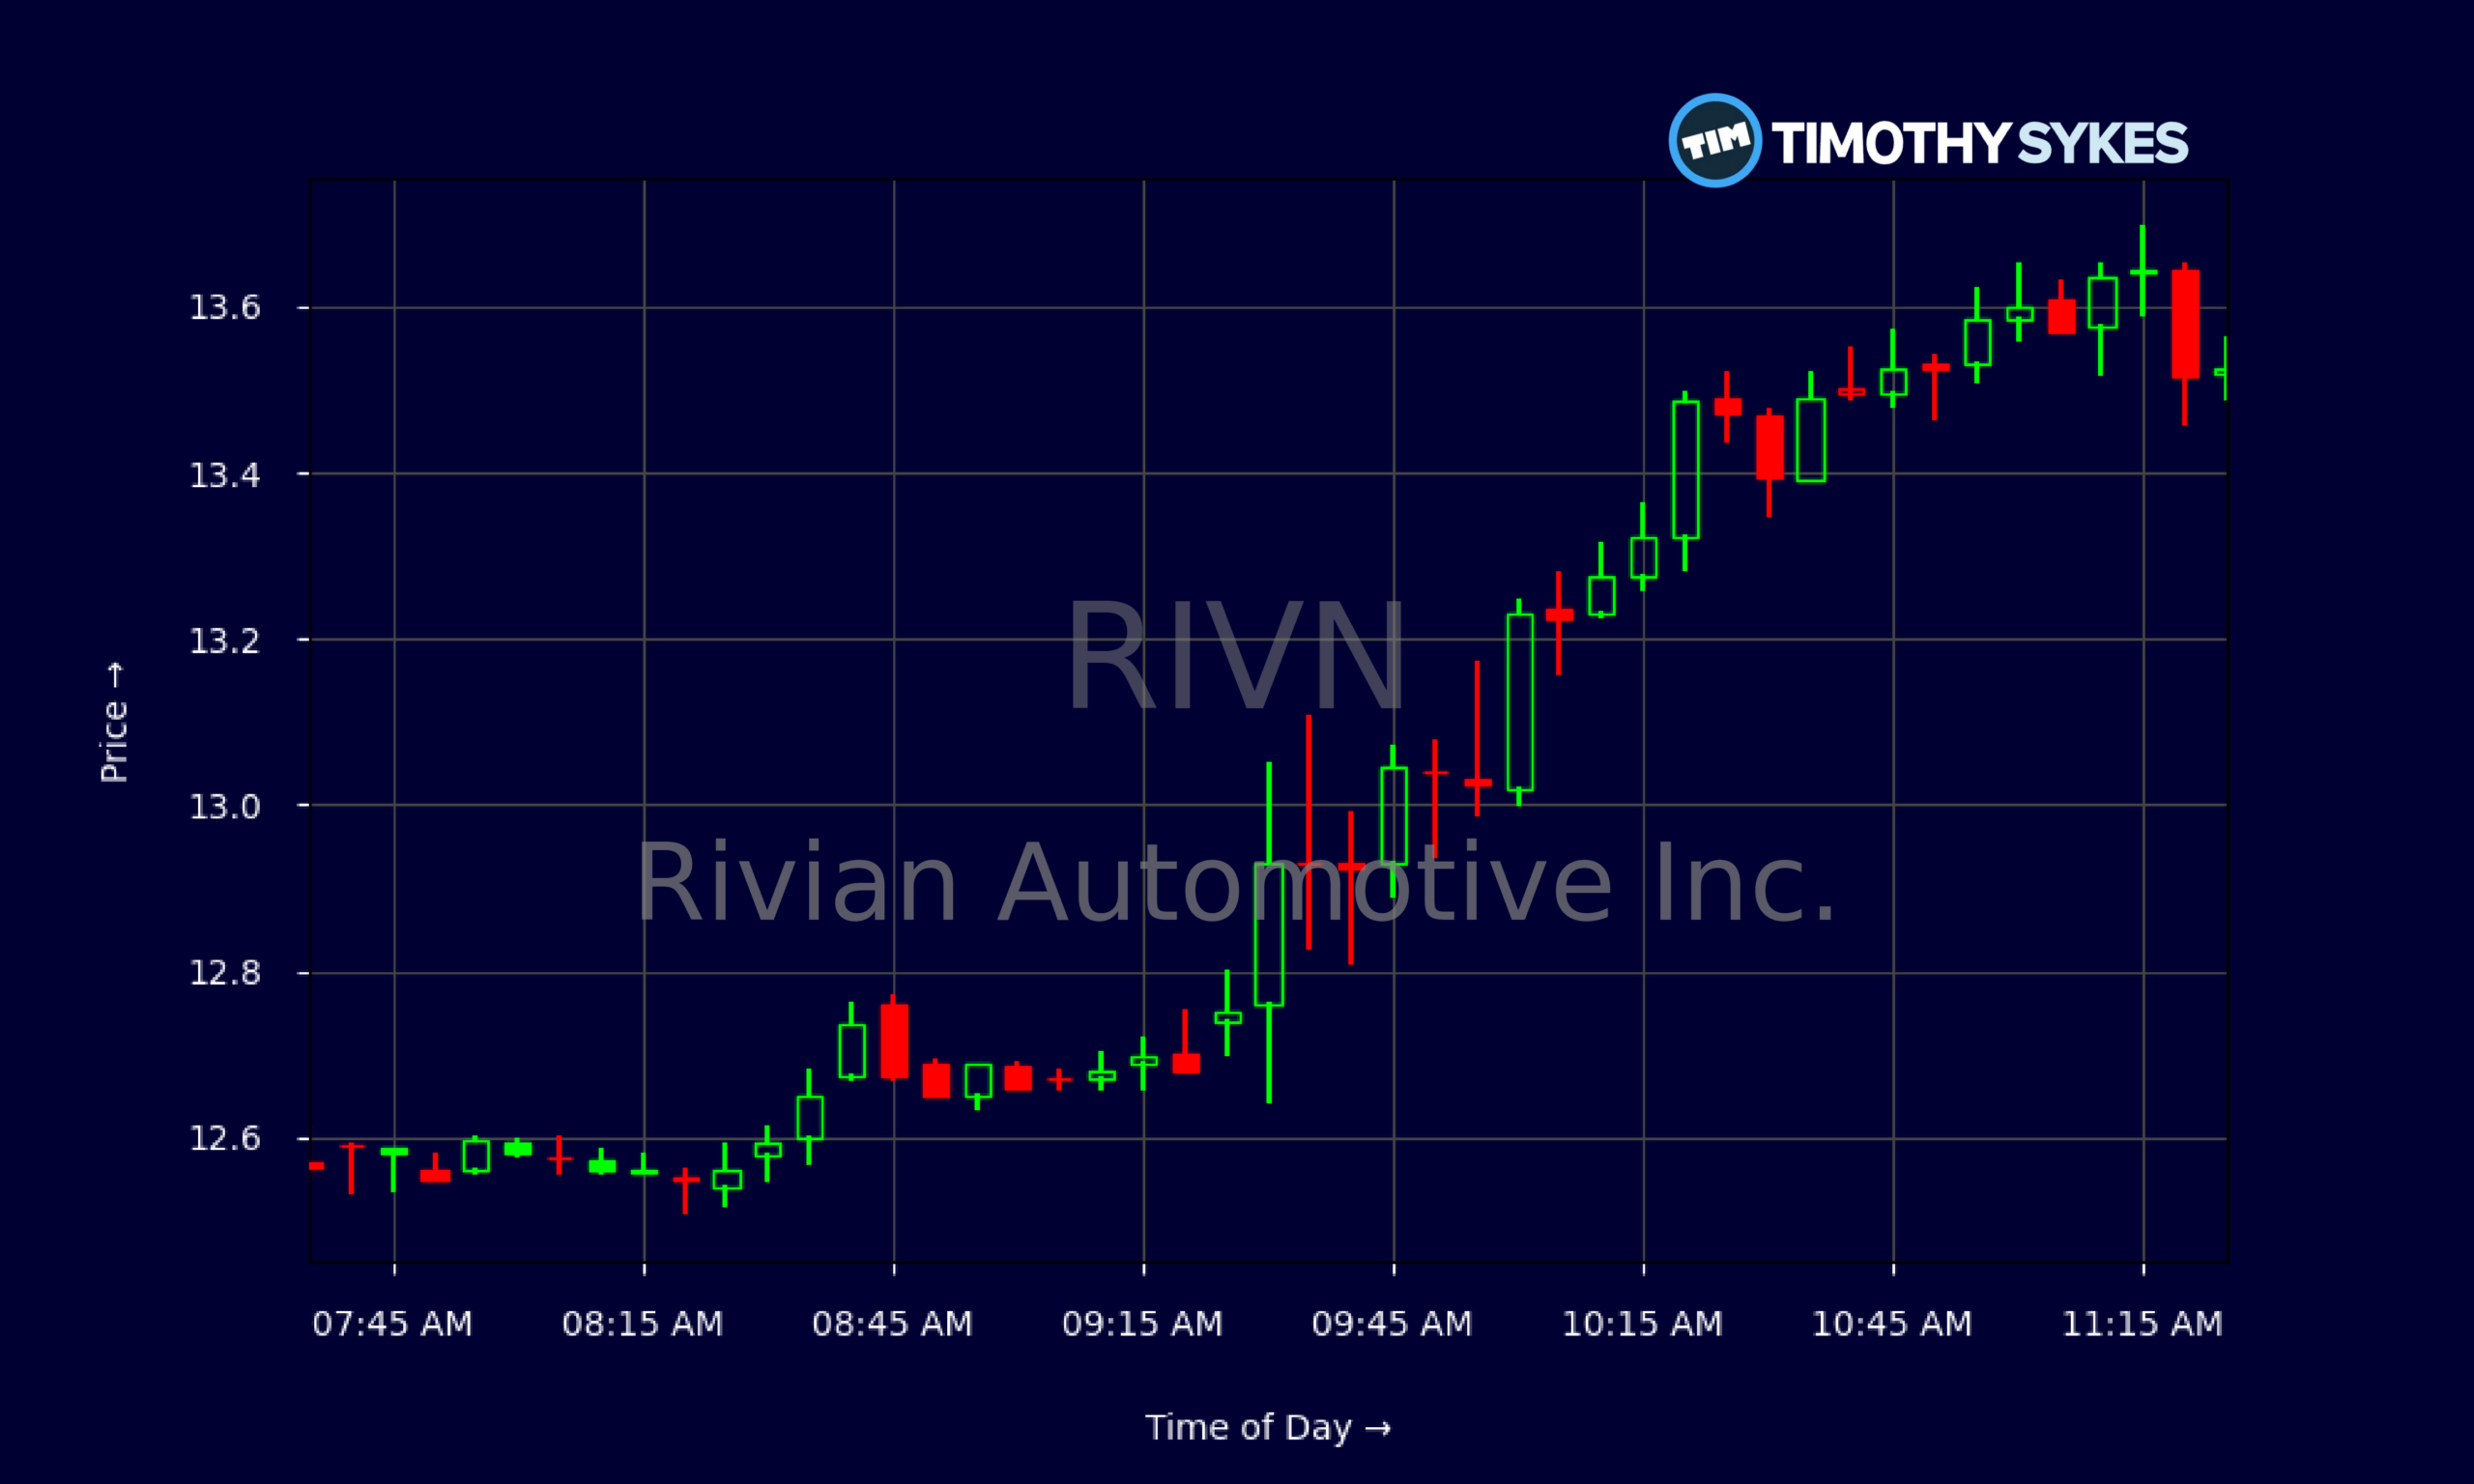
Live Update At 11:32:31 EST: On Monday, November 02, 2026 Rivian Automotive Inc. stock [NASDAQ: RIVN] is trending up by 11.31%! Discover the key drivers behind this movement as well as our expert analysis in the detailed breakdown below.
Quick Financial Overview
Rivian Automotive Inc., ticker RIVN, just delivered a quarter that grabbed traders’ attention. Q3 revenue came in around $2.15B–$2.16B, ahead of the roughly $2.0B Wall Street expected. That top-line beat, combined with an adjusted loss of -$0.48 per share versus estimates closer to -$0.64, shows RIVN is still bleeding cash, but doing it more efficiently as volume ramps.
Under the hood, the R2 has already become Rivian’s best-selling vehicle, helping push gross margin positive at about 7.5%. Profitability is still far away — EBIT margin sits near -50%, and profit margin around -55%. But for growth-focused traders, the direction of travel matters more than the current level.
On the balance sheet, RIVN holds about $3.509B in cash and $5.502B in cash plus short-term investments, against total debt obligations (including leases) of roughly $5.309B. A current ratio of 2.1 and quick ratio of 1.6 tell traders the company has breathing room, but not a blank check.
More Breaking News
Technically, RIVN has bounced from the low-$12s to around $13.54 on 2026/11/02, after dipping as low as $11.42 in late October. Intraday 5‑minute candles show steady buying from the $12.90 open area toward the mid‑$13s, signaling real demand stepping in after earnings.
Why Traders Are Watching RIVN’s Momentum Build
RIVN is back on many watchlists because the story finally lines up: better numbers, visible demand, and fresh catalysts. The earnings beat is the anchor. When a high-burn EV name like Rivian prints $2.155B in Q3 revenue versus a $2.0B consensus and narrows losses to -$0.48 per share, traders see proof that scale is kicking in.
The R2 is central to this. Management says it is now Rivian’s top seller, with strong Q3 order conversion for the high-end launch trim. Jefferies leaned hard into that, upgrading RIVN from Hold to Buy and pinning a $17 price target on the stock after about a 30% pullback. They argue Rivian has carved out a defensible position in the $45,000–$55,000 EV bracket, between Tesla’s more commoditized models and whatever Ford brings next.
At the same time, Rivian isn’t just chasing volume. It’s buying brains. The acquisition of Third Dimension AI brings an AI-powered 3D spatial generation and simulation stack in-house, plugging straight into Rivian’s Autonomy & AI group. That should speed up synthetic data generation, full-world simulation, and testing for advanced driver-assistance and future robotaxis. For traders, that is long-dated optionality — the kind of autonomy story the market is willing to pay up for when sentiment swings risk-on.
There’s also the quieter tech angle: through a joint venture with Volkswagen Group Technologies, Rivian is co-developing a zonal, software-defined vehicle architecture using NXP S32K5 chips, slated for 2027 production. That keeps RIVN in the conversation as a software-defined EV platform, not just another hardware OEM.
Add in rumor fuel — like a Rivian commercial van spotted in Walmart+ livery with no confirmed deal — and you get the kind of speculative buzz that often amplifies short-term trading moves.
Conclusion
For all the momentum, RIVN is still a loss machine. Management’s FY26 guide calls for adjusted EBITDA between -$1.85B and -$1.75B on 67,000–70,000 deliveries. That’s real volume growth, but also real cash burn. Free cash flow in the latest quarter was about -$1.124B, and net income was roughly -$913M. Traders ignoring that risk are not doing serious homework.
Wall Street is split, and that helps explain RIVN’s volatility. Jefferies is now on the bullish side with a $17 Buy rating, while Cantor Fitzgerald trimmed its target from $19 to $16 and stayed Neutral, even after the revenue beat and raised FY26 delivery and capex outlook. The broader analyst consensus still sits around Hold with an average target near $18.58, signaling belief in Rivian’s growth tempered by skepticism on profitability timelines.
Layer on the autonomy and software story — Third Dimension AI, the Volkswagen/NXP architecture, the Uber robotaxi partnership referenced in recent commentary — and Rivian starts to look like more than a cyclical auto name. It becomes a complex, narrative-driven trade.
For active traders studying RIVN, this is where discipline matters. As Tim Sykes likes to say, “Cut losses quickly, because big losers always start as small ones.” As millionaire penny stock trader and teacher Tim Sykes says, “It’s better to go home at zero than to go home in the red.”. RIVN now has real catalysts, real scale, and real risk. Use the chart, track the news, and treat every trade in this name as a tactical move, not a belief system.
This is stock news, not investment advice. Timothy Sykes News delivers real-time stock market news focused on key catalysts driving short-term price movements. Our content is tailored for active traders and investors seeking to capitalize on rapid price fluctuations, particularly in volatile sectors like penny stocks. Readers come to us for detailed coverage on earnings reports, mergers, FDA approvals, new contracts, and unusual trading volumes that can trigger significant short-term price action. Some users utilize our news to explain sudden stock movements, while others rely on it for diligent research into potential investment opportunities.
Dive deeper into the world of trading with Timothy Sykes, renowned for his expertise in penny stocks. Explore his top picks and discover the strategies that have propelled him to success with these articles:
- Penny Stocks Trading Guide
- Best Penny Stocks Under $1 to Buy Today
- Top 8 Penny Stocks to Watch on Robinhood
Once you’ve got some stocks on watch, elevate your trading game with StocksToTrade the ultimate platform for traders. With specialized tools for swing and day trading, StocksToTrade will guide you through the market’s twists and turns.
Dig into StocksToTrade’s watchlists here:





Leave a reply