

JetBlue Airways Corporation stocks have been trading up by 11.12 percent amid upbeat sentiment on improved earnings and cost controls.
Key Takeaways JBLU Traders Need Now
- Q3 2026 revenue came in at $2.81B versus $2.83B expected, with EPS at -$0.68 versus -$0.55, but JBLU still posted year-over-year adjusted operating margin improvement.
- Q3 unit revenue was strong, with RASM up 18.4% and system revenue up 21.1%, helped by nearly 15% RASM growth in Fort Lauderdale on more than 65% capacity growth.
- Under JetForward, JBLU targets operating profitability in 2027 and at least $1.00 EPS plus positive free cash flow in 2028, driven by $850M–$950M incremental EBIT in 2027 and about $1.2B by 2028.
- For Q4, JBLU sees ASMs up 3%–4%, RASM up 18%–22%, CASM ex-fuel flat to slightly lower, and 1–2 points of margin expansion despite an 85% jump in fuel costs.
- UBS upgraded JBLU from Sell to Neutral with a $3.50 target, flagging enough liquidity to manage cash burn through most of 2027, but still models negative free cash flow until at least 2028 and about $1B of new debt in 2027.
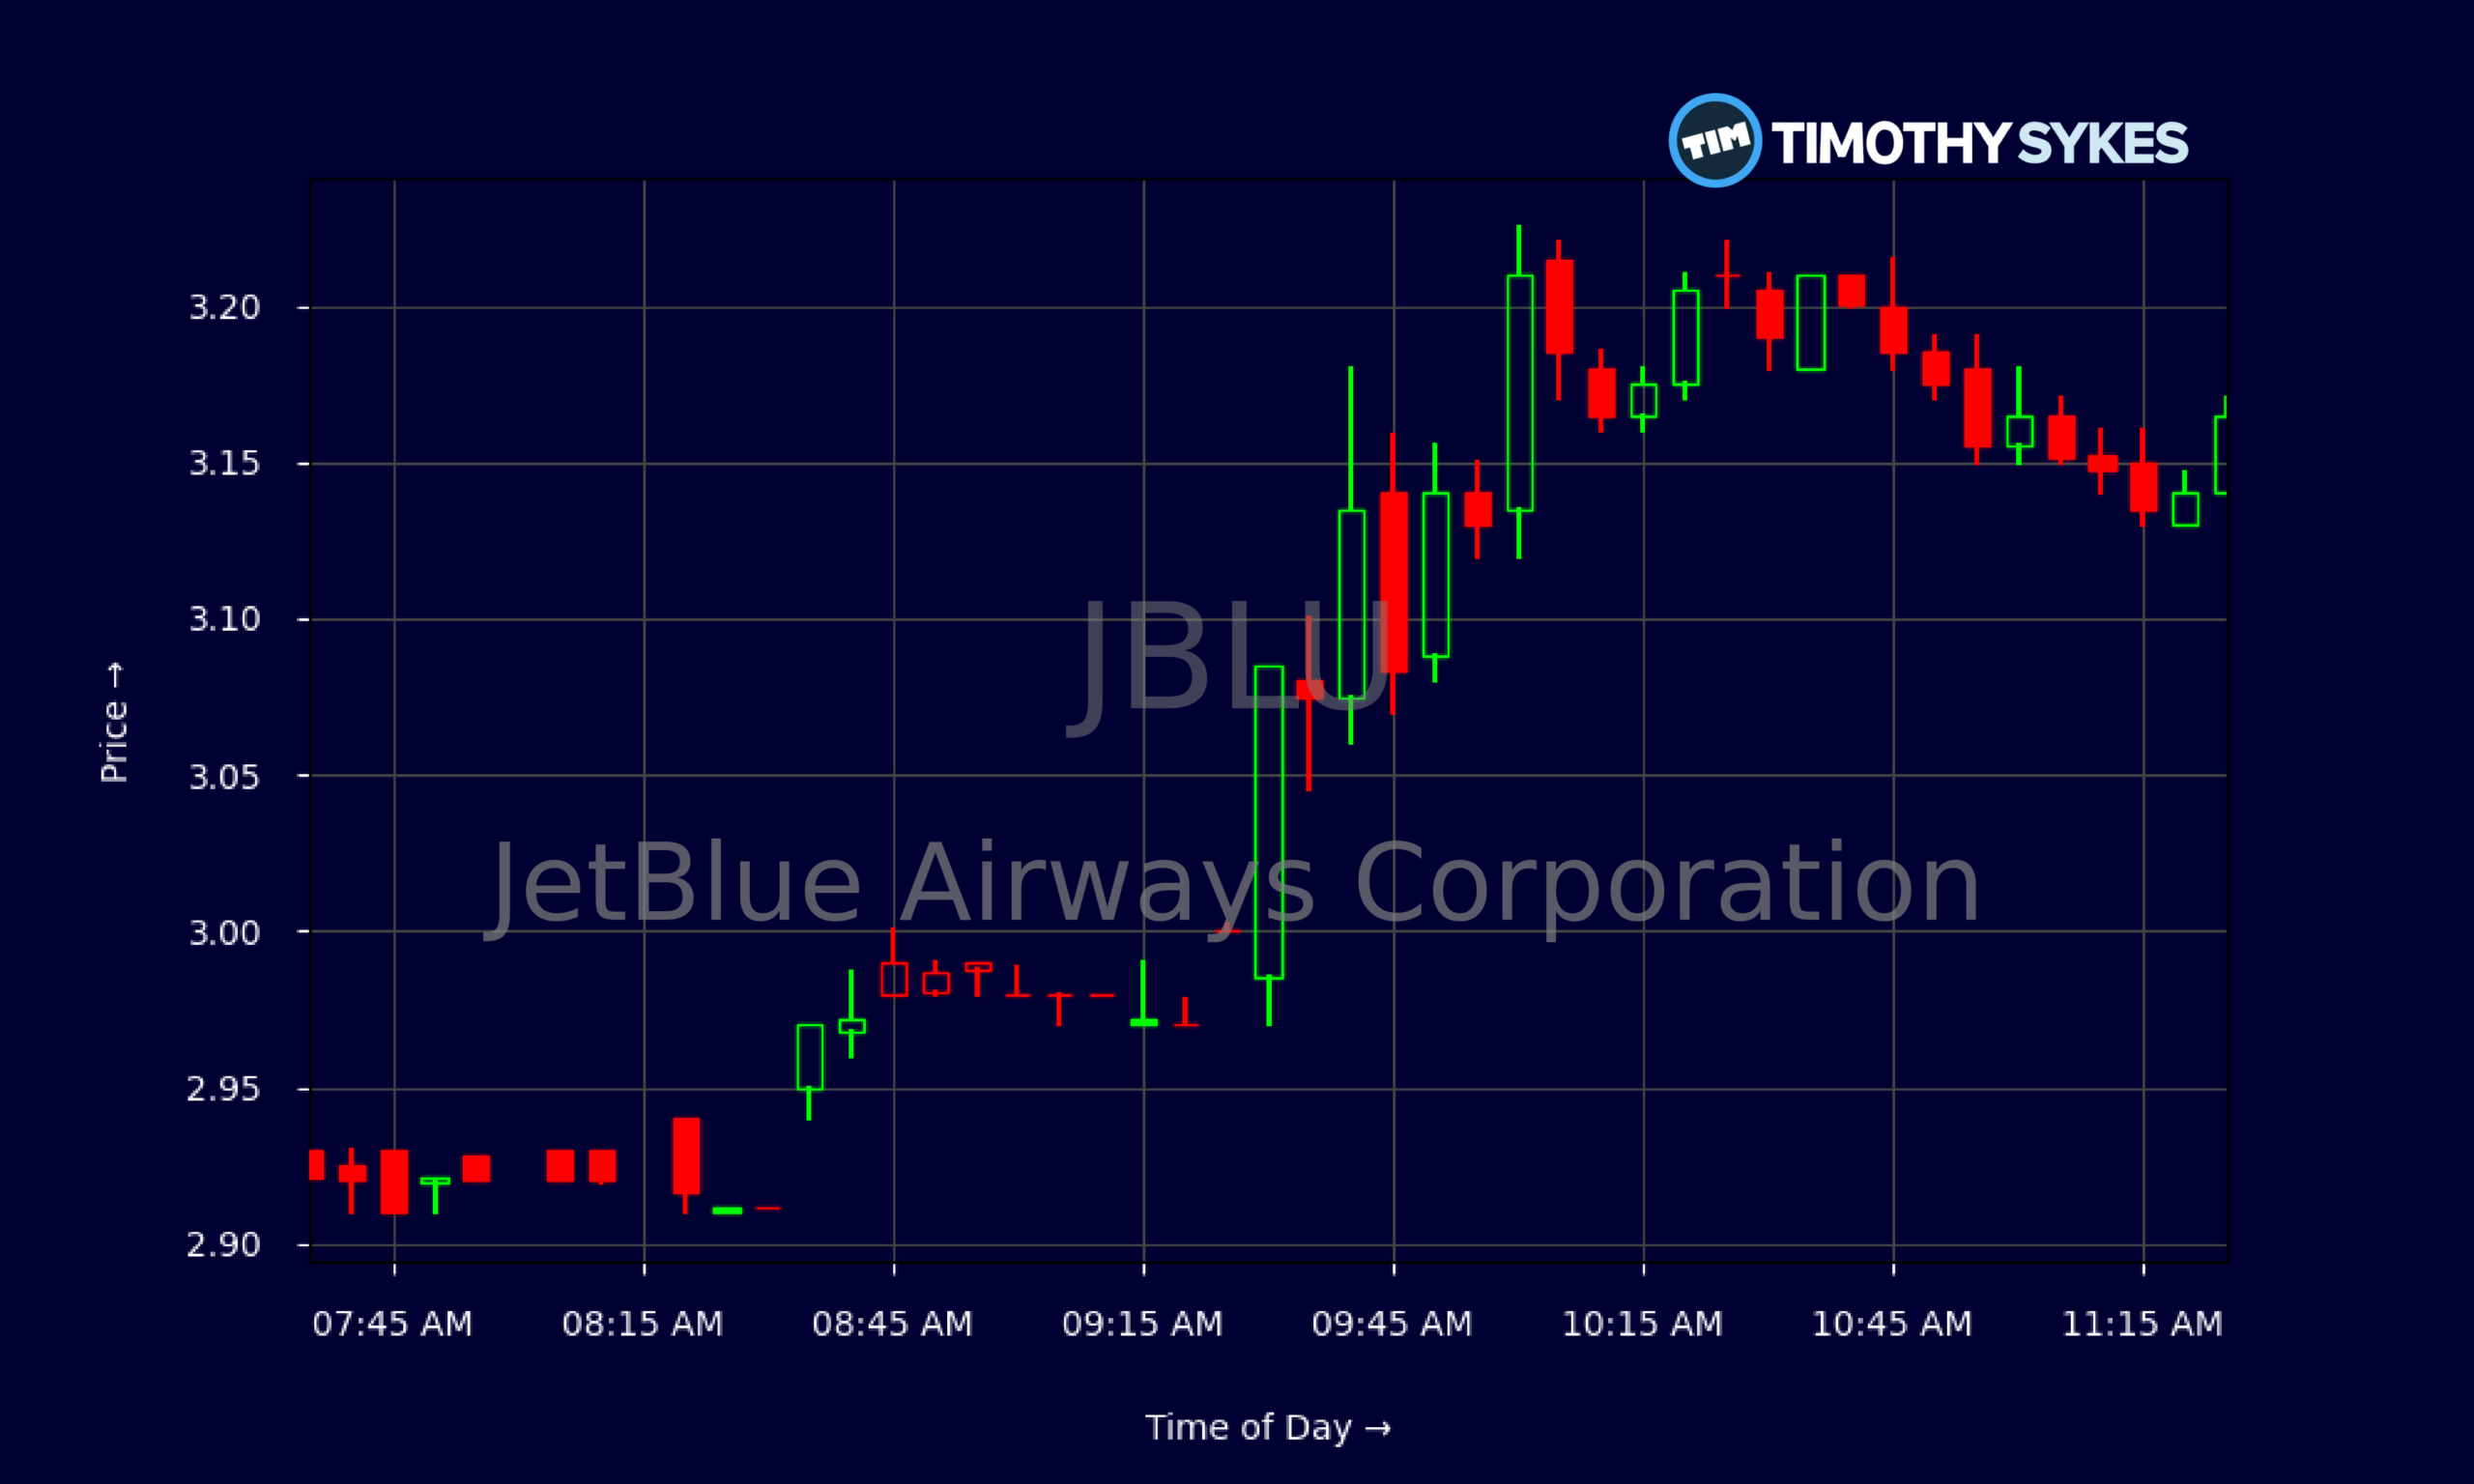
Live Update At 11:31:58 EST: On Monday, November 02, 2026 JetBlue Airways Corporation stock [NASDAQ: JBLU] is trending up by 11.12%! Discover the key drivers behind this movement as well as our expert analysis in the detailed breakdown below.
Quick Financial Overview
JBLU has been a textbook beaten-down airline chart, but lately it is starting to fight back. Over the last few weeks, JetBlue Airways Corporation slid from above $3.80 down toward the mid-$2s, then bounced. The recent daily close around $3.17 shows buyers slowly stepping back in after heavy selling.
Look at the recent range: from 2026/10/08 to 2026/11/02, JBLU dropped from about $3.92 to below $2.20 at the lows before reclaiming the low-$3s. That is classic volatility that short-term traders love. Intraday, today’s 5‑minute tape shows a steady grind higher from the premarket $2.90s into the $3.20 area, with tight candles and higher lows. That points to accumulation rather than a random spike.
Fundamentals still look stressed. Revenue over the last year sits near $9.06B, yet margins are negative. EBIT margin is about -4.6%, and net margins are roughly -9%. JBLU is carrying a high debt load, with total debt-to-equity above 5 and a current ratio around 0.7, so liquidity and refinancing risk stay front and center.
More Breaking News
For traders, that mix — ugly balance sheet, improving revenue trends, and a low price-to-sales ratio near 0.15 — sets up JBLU as a classic turnaround and sentiment swing play, not a safe long-term hold.
Why Traders Are Watching The JBLU Turnaround Story
The real reason active traders are stalking JBLU right now is the JetForward turnaround roadmap. Management is not just talking in vague goals. JetBlue Airways Corporation is putting hard numbers on the table: at least $310M in incremental EBIT in 2026, ramping to $850M–$950M in 2027 and about $1.2B by 2028. If JBLU hits those marks, the company expects operating profitability in 2027 and at least $1.00 in EPS plus positive free cash flow in 2028.
That is a big shift from today’s reality. Q3 EPS came in at -$0.68 versus -$0.55 expected, so JBLU is still losing money. But unit revenue is ripping higher. RASM jumped 18.4% year over year, and system revenue grew 21.1%. Fort Lauderdale was a standout, with roughly 15% RASM growth on more than 65% capacity growth. That tells traders one thing: demand is there, and JBLU has pricing power in key markets.
For Q4, guidance backs that up. JetBlue is calling for capacity up 3%–4%, RASM up 18%–22%, and CASM ex-fuel flat to slightly lower, even while fuel costs are up about 85%. Management also expects 1–2 percentage points of margin expansion. If JBLU delivers on those numbers, a lot of beaten‑down sentiment can unwind fast.
On the sentiment side, the CEO publicly said JBLU is not in talks with creditors and is not considering a debt restructuring. That single comment triggered a near 19% spike in the stock, showing how sensitive JBLU trading is to balance‑sheet rumors. Add in UBS shifting from Sell to Neutral with a $3.50 target and arguing that liquidity is adequate through most of 2027, and you have the early stages of a narrative turn.
Conclusion
For traders, JBLU now trades like a pure execution story. The JetForward plan lays out a clear path: Q3 and Q4 show improving margins and strong RASM, Paisley adds roughly $100M in operating income this year with the potential to nearly double by 2028, and loyalty upgrades through TrueBlue and BlueFirst aim to lock in higher-value customers starting 2027/02/01. None of that erases JBLU’s leverage, negative free cash flow, or the expectation of roughly $1B in new debt in 2027, but it does give a framework to track quarter by quarter.
The tape confirms this tug of war. JBLU is bouncing from washed‑out levels near $2.20–$2.40 back into the low-$3s, with intraday action showing steady buying rather than just one‑and‑done spikes. Traders in the Timothy Sykes community focus on that kind of shift: beaten charts where the story starts to improve and shorts get crowded. As millionaire penny stock trader and teacher Tim Sykes says, “Be patient, don’t force trades, and let the perfect setups come to you.” That mindset applies here: waiting for clean confirmation on the chart, rather than chasing every move, can help traders frame JBLU as a disciplined execution play instead of a random gamble.
This is still a speculative, high‑risk airline turnaround, not a safe haven. Balance‑sheet pressure, fuel costs, and execution missteps can all smack JBLU back down. As Tim Sykes likes to say, “The market doesn’t care about your opinion, only the price action — cut losses quickly and let the chart prove the story, not the other way around.” For JBLU, that means treating every bounce, breakout, and pullback as data in a live experiment, not a guarantee.
This is stock news, not investment advice. Timothy Sykes News delivers real-time stock market news focused on key catalysts driving short-term price movements. Our content is tailored for active traders and investors seeking to capitalize on rapid price fluctuations, particularly in volatile sectors like penny stocks. Readers come to us for detailed coverage on earnings reports, mergers, FDA approvals, new contracts, and unusual trading volumes that can trigger significant short-term price action. Some users utilize our news to explain sudden stock movements, while others rely on it for diligent research into potential investment opportunities.
Dive deeper into the world of trading with Timothy Sykes, renowned for his expertise in penny stocks. Explore his top picks and discover the strategies that have propelled him to success with these articles:
- Penny Stocks Trading Guide
- Best Penny Stocks Under $1 to Buy Today
- Top 8 Penny Stocks to Watch on Robinhood
Once you’ve got some stocks on watch, elevate your trading game with StocksToTrade the ultimate platform for traders. With specialized tools for swing and day trading, StocksToTrade will guide you through the market’s twists and turns.
Dig into StocksToTrade’s watchlists here:





Leave a reply