

Rocket Companies Inc. stocks have been trading up by 8.67 percent after upbeat mortgage demand data signaled strengthening housing activity.
Key Takeaways
- Q3 adjusted EPS landed at $0.15 for Rocket Companies, topping consensus estimates in the $0.13–$0.14 range despite a tough rate backdrop.
- Quarterly revenue surged to $3.28B versus $2.58B expected, with RKT posting its strongest profitability margin in nearly five years and claiming market share gains in purchase and refinance.
- Management guided Q4 revenue to $2.10B–$2.30B, pointing to solid but lower activity after an unusually strong Q3 surge.
- Stephens trimmed its RKT price target to $16.00 from $16.50 but kept an Overweight rating, while JPMorgan nudged its target up to $13 and stayed Neutral.
- RBC cut its Rocket target to $14 from $16 with a Sector Perform view, even as the Street’s mean target sits higher at $15.42 and skewed toward overweight ratings.
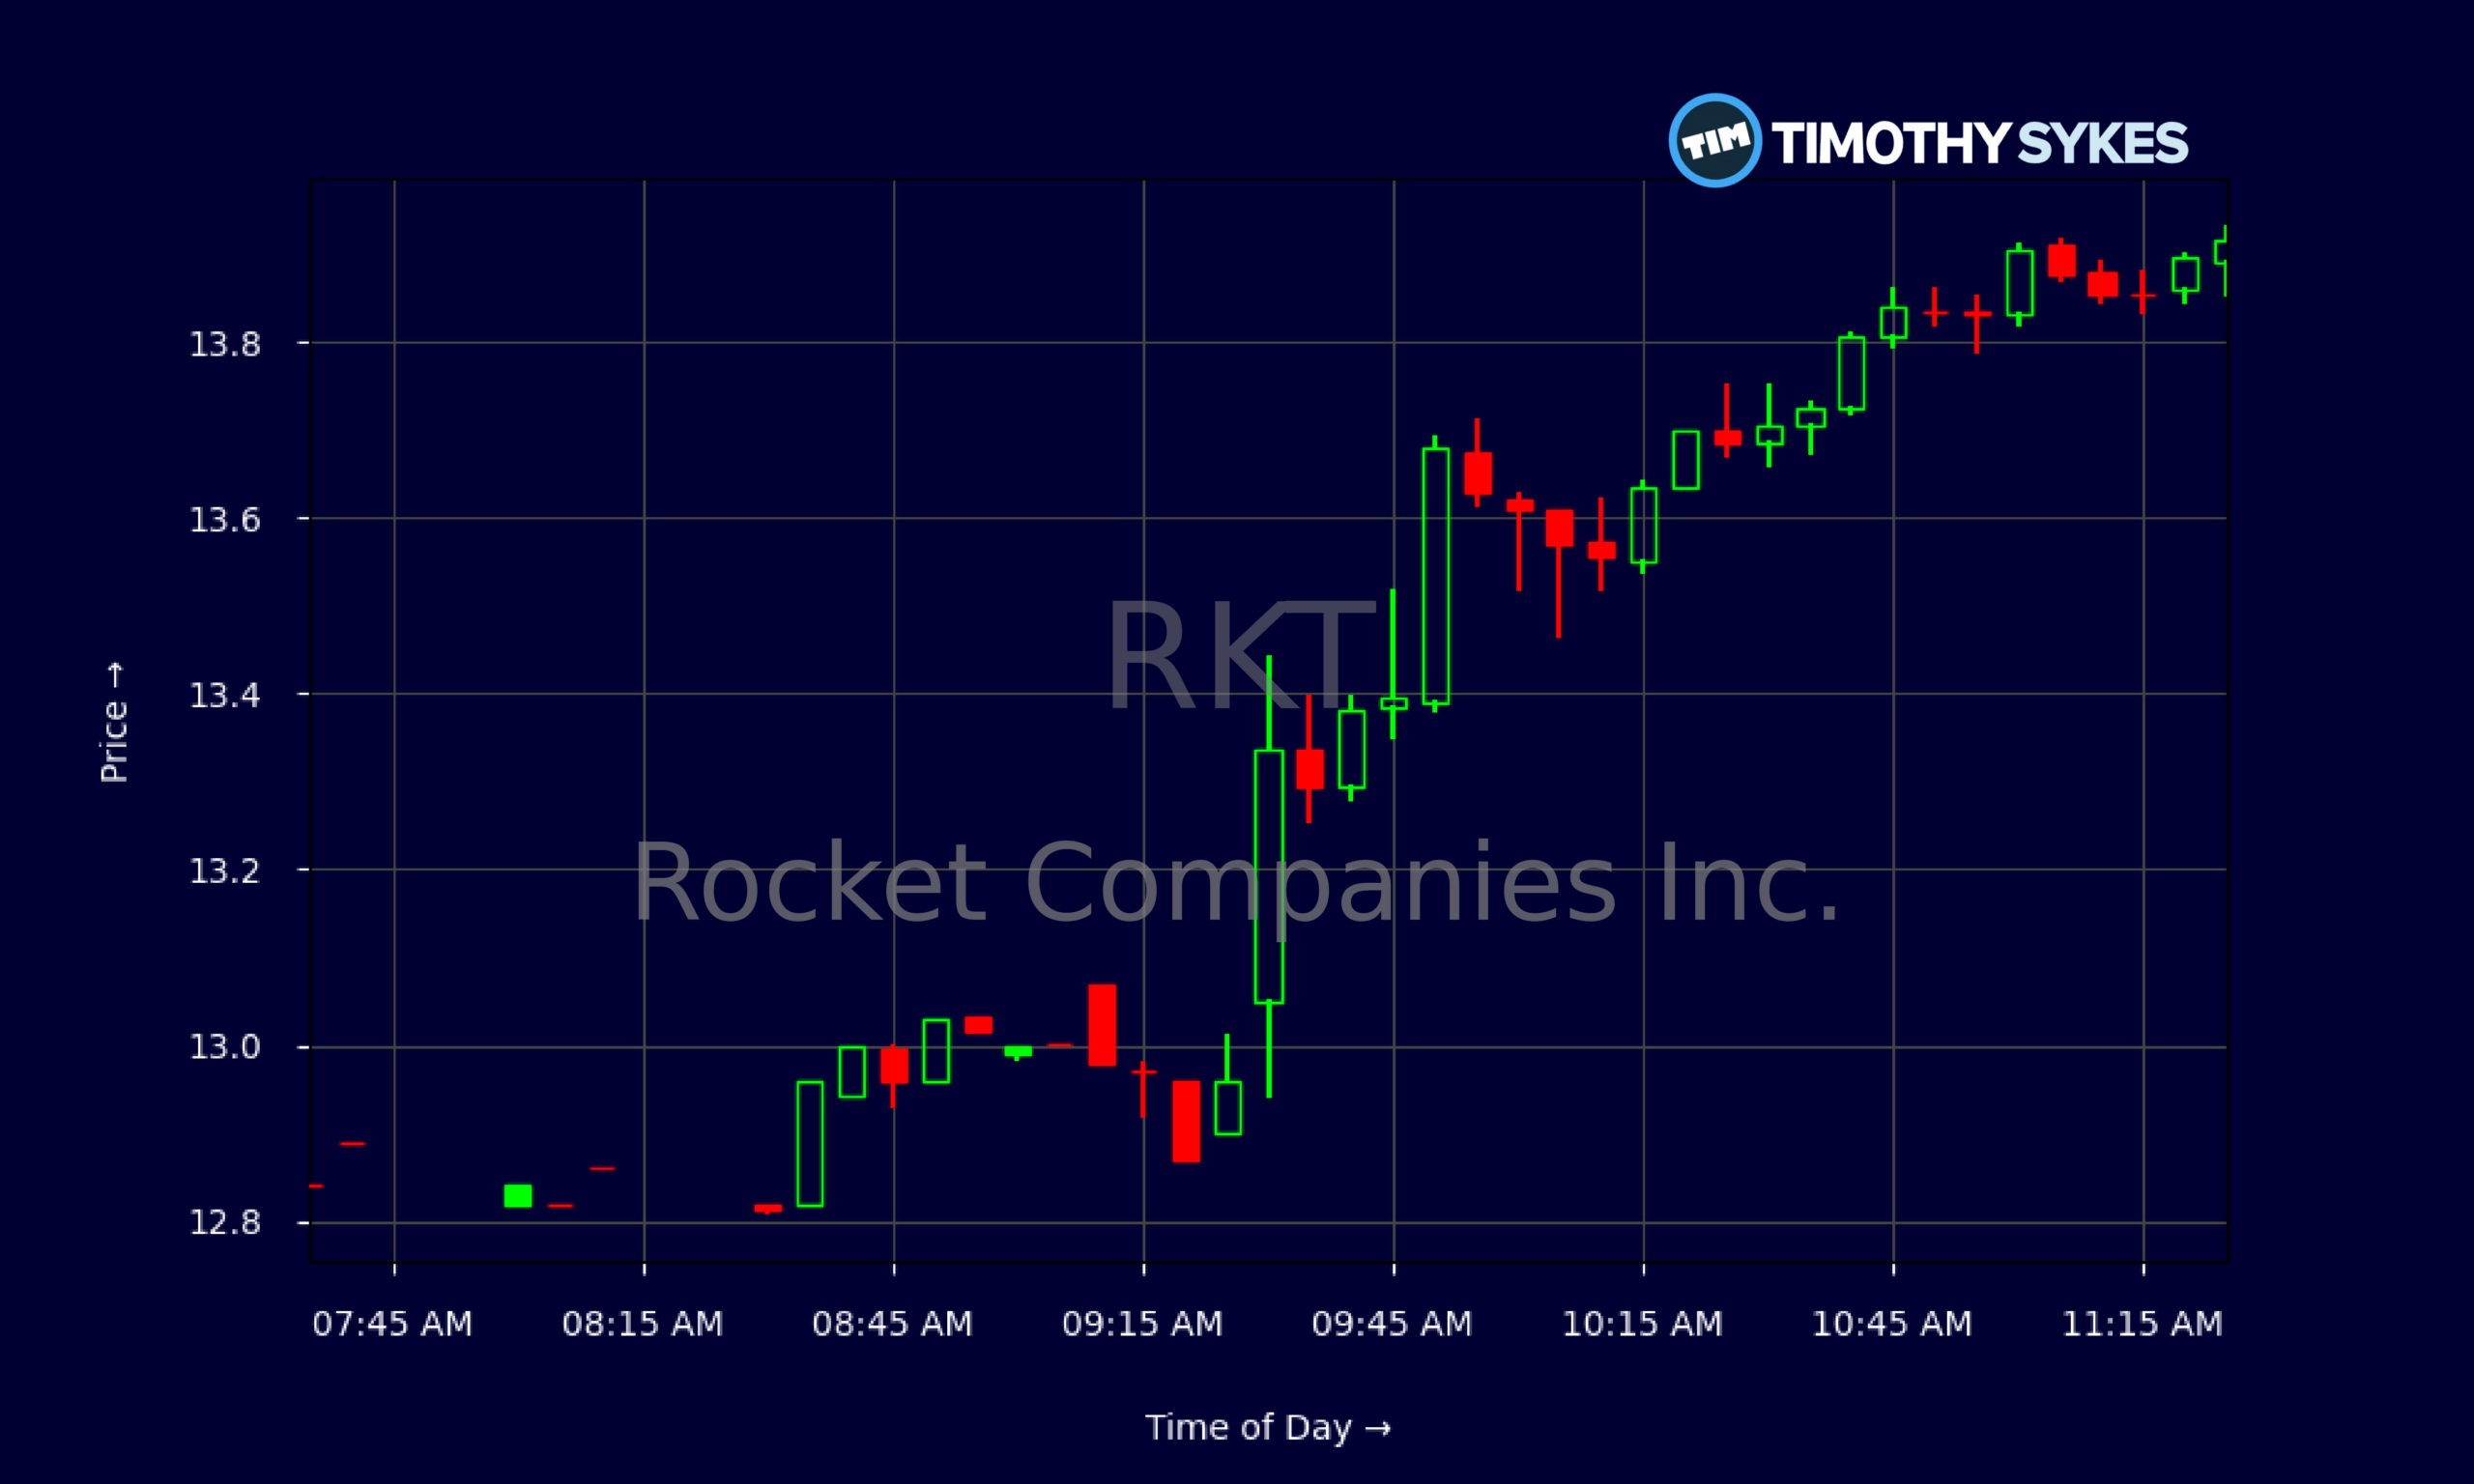
Live Update At 11:32:19 EST: On Monday, November 02, 2026 Rocket Companies Inc. stock [NYSE: RKT] is trending up by 8.67%! Discover the key drivers behind this movement as well as our expert analysis in the detailed breakdown below.
Quick Financial Overview
RKT is trading like a name that just got a strong shot of adrenaline. On 2026/11/02, Rocket Companies opened near $13.05 and pushed as high as $13.93, closing at $13.91. That’s a sharp move up from the $10s and low $11s seen from 2026/10/08 through 2026/10/30, where RKT mostly chopped between roughly $10.5 and $11.9. The recent breakout shows traders are reacting to real news, not random noise.
Intraday, the 5‑minute chart screams steady demand. After a premarket base around $12.8–$13, RKT ramped from the opening print at $13.05 and held a tight range in the high $13s. Dips toward $13.55–$13.60 kept getting bought, with higher lows building all morning. That’s classic trend‑day behavior.
More Breaking News
Under the hood, Rocket Companies printed about $6.26B in trailing revenue, with a price‑to‑sales ratio near 3.63 and a rich P/E around 52. That tells traders the market is already paying up for growth and margin improvement. Debt is meaningful, with total debt‑to‑equity at 1.16, but cash flow is strong: free cash flow of roughly $1.86B and operating cash flow around $1.90B in the latest quarter. For active traders, this is a story of momentum backed by real earnings power in a rate‑sensitive sector.
Why Traders Are Watching RKT After This Earnings Beat
RKT just reminded the market why Rocket Companies is still the heavyweight in U.S. mortgage and housing tech. The company reported Q3 adjusted EPS of $0.15, beating consensus and doubling year over year. Depending on which report you focus on, Rocket Companies’ Q3 revenue is framed at $2.57B versus $2.6B expected, or $3.28B versus $2.58B expected on a FactSet basis. Either way, the takeaway is the same: RKT outperformed what Wall Street was modeling.
The more important piece for traders is quality of earnings. Management highlighted that Rocket Companies delivered its highest profitability margin in nearly five years, even while mortgage rates sat near three‑year highs and Redfin data signaled a cooling housing market. That means RKT is not just riding a hot macro wave. It is squeezing more out of each loan and each customer, supported by earlier tech and distribution investments.
Guidance is where the tug‑of‑war starts. Rocket Companies guided Q4 revenue to $2.10B–$2.30B, a step down from Q3’s surge. That’s why, despite the beat, RKT shares slipped in after‑hours trading around the report. The market is trading the idea that Q3 might be “as good as it gets” for now.
Wall Street’s reaction matches that mixed setup. Stephens shaved its RKT target to $16 but kept an Overweight rating, signaling they still see upside from current levels. JPMorgan nudged its target to $13 while staying Neutral, and RBC cut its target to $14 with a Sector Perform call. Yet the Street’s average view on Rocket Companies remains overweight with a mean target of $15.42. For short‑term traders, that spread in opinions can create volatility and opportunity as RKT swings between bullish and cautious narratives.
On top of mortgages, Redfin—now under the Rocket Companies umbrella—adds another catalyst. Redfin data shows very high mortgage payments, softer demand, and the first year‑over‑year decline in median home‑sale prices in more than three years, but also a more balanced, buyer‑tilted market. Rocket Companies is leaning into this with tech‑driven tools and marketing plays like “Redfin Presents Iconic Homes of America,” designed to pull more eyeballs and leads into the ecosystem through 2027. For traders, that longer‑term platform story sits behind the near‑term earnings fireworks but matters for the bigger chart.
Conclusion
For active traders, RKT is a classic “strong company, debated direction” setup. On one side, Rocket Companies just printed a powerful quarter: adjusted EPS at $0.15, revenue well ahead of expectations, and the best margins in almost five years. Cash flow remains robust, and the multi‑day chart shows a clear trend higher from the $10–$11 zone into the high $13s. That’s not random; that’s the tape confirming the fundamentals.
On the other side, Rocket Companies is guiding Q4 revenue down to the $2.10B–$2.30B range, and the housing data from Redfin points to a cooler, more cautious market with stretched affordability. Analyst targets are drifting around rather than ripping higher in unison—Stephens and RBC trimmed, JPMorgan only inched its target up. That tells traders the Street respects RKT’s execution but still questions how long these margins last if volumes slow.
This is exactly the kind of name Tim Sykes and Tim Bohen talk about when they say, “Trade the price action, not the story.” As millionaire penny stock trader and teacher Tim Sykes says, “Cut losses quickly, let profits ride, and don’t overtrade.” The story around RKT—rate headwinds, housing cycles, tech platform expansion—is complex and always changing. The price action, though, is simple to track. For educational and research purposes, the approach is straightforward: map key levels, respect your risk, apply disciplined trading rules like Sykes’ mantra, and let Rocket Companies’ next set of numbers confirm or reject this new uptrend before making any big trading decisions.
This is stock news, not investment advice. Timothy Sykes News delivers real-time stock market news focused on key catalysts driving short-term price movements. Our content is tailored for active traders and investors seeking to capitalize on rapid price fluctuations, particularly in volatile sectors like penny stocks. Readers come to us for detailed coverage on earnings reports, mergers, FDA approvals, new contracts, and unusual trading volumes that can trigger significant short-term price action. Some users utilize our news to explain sudden stock movements, while others rely on it for diligent research into potential investment opportunities.
Dive deeper into the world of trading with Timothy Sykes, renowned for his expertise in penny stocks. Explore his top picks and discover the strategies that have propelled him to success with these articles:
- Penny Stocks Trading Guide
- Best Penny Stocks Under $1 to Buy Today
- Top 8 Penny Stocks to Watch on Robinhood
Once you’ve got some stocks on watch, elevate your trading game with StocksToTrade the ultimate platform for traders. With specialized tools for swing and day trading, StocksToTrade will guide you through the market’s twists and turns.
Dig into StocksToTrade’s watchlists here:




Leave a reply