

Oruka Therapeutics Inc. stocks have been trading up by 11.33 percent following pivotal positive drug development news.
Key Takeaways
- ORKA has climbed from the low $70s to the high $80s this month, signaling steady buying pressure on the daily chart.
- Intraday action shows ORKA consolidating around $89–$90 after a strong morning push, a classic afternoon holding pattern.
- Oruka Therapeutics Inc. reports roughly $873.6M in cash and short-term investments and zero net debt, giving traders confidence in its runway.
- Heavy quarterly cash burn and negative earnings keep ORKA in high-risk, high-reward territory for momentum-style trading.
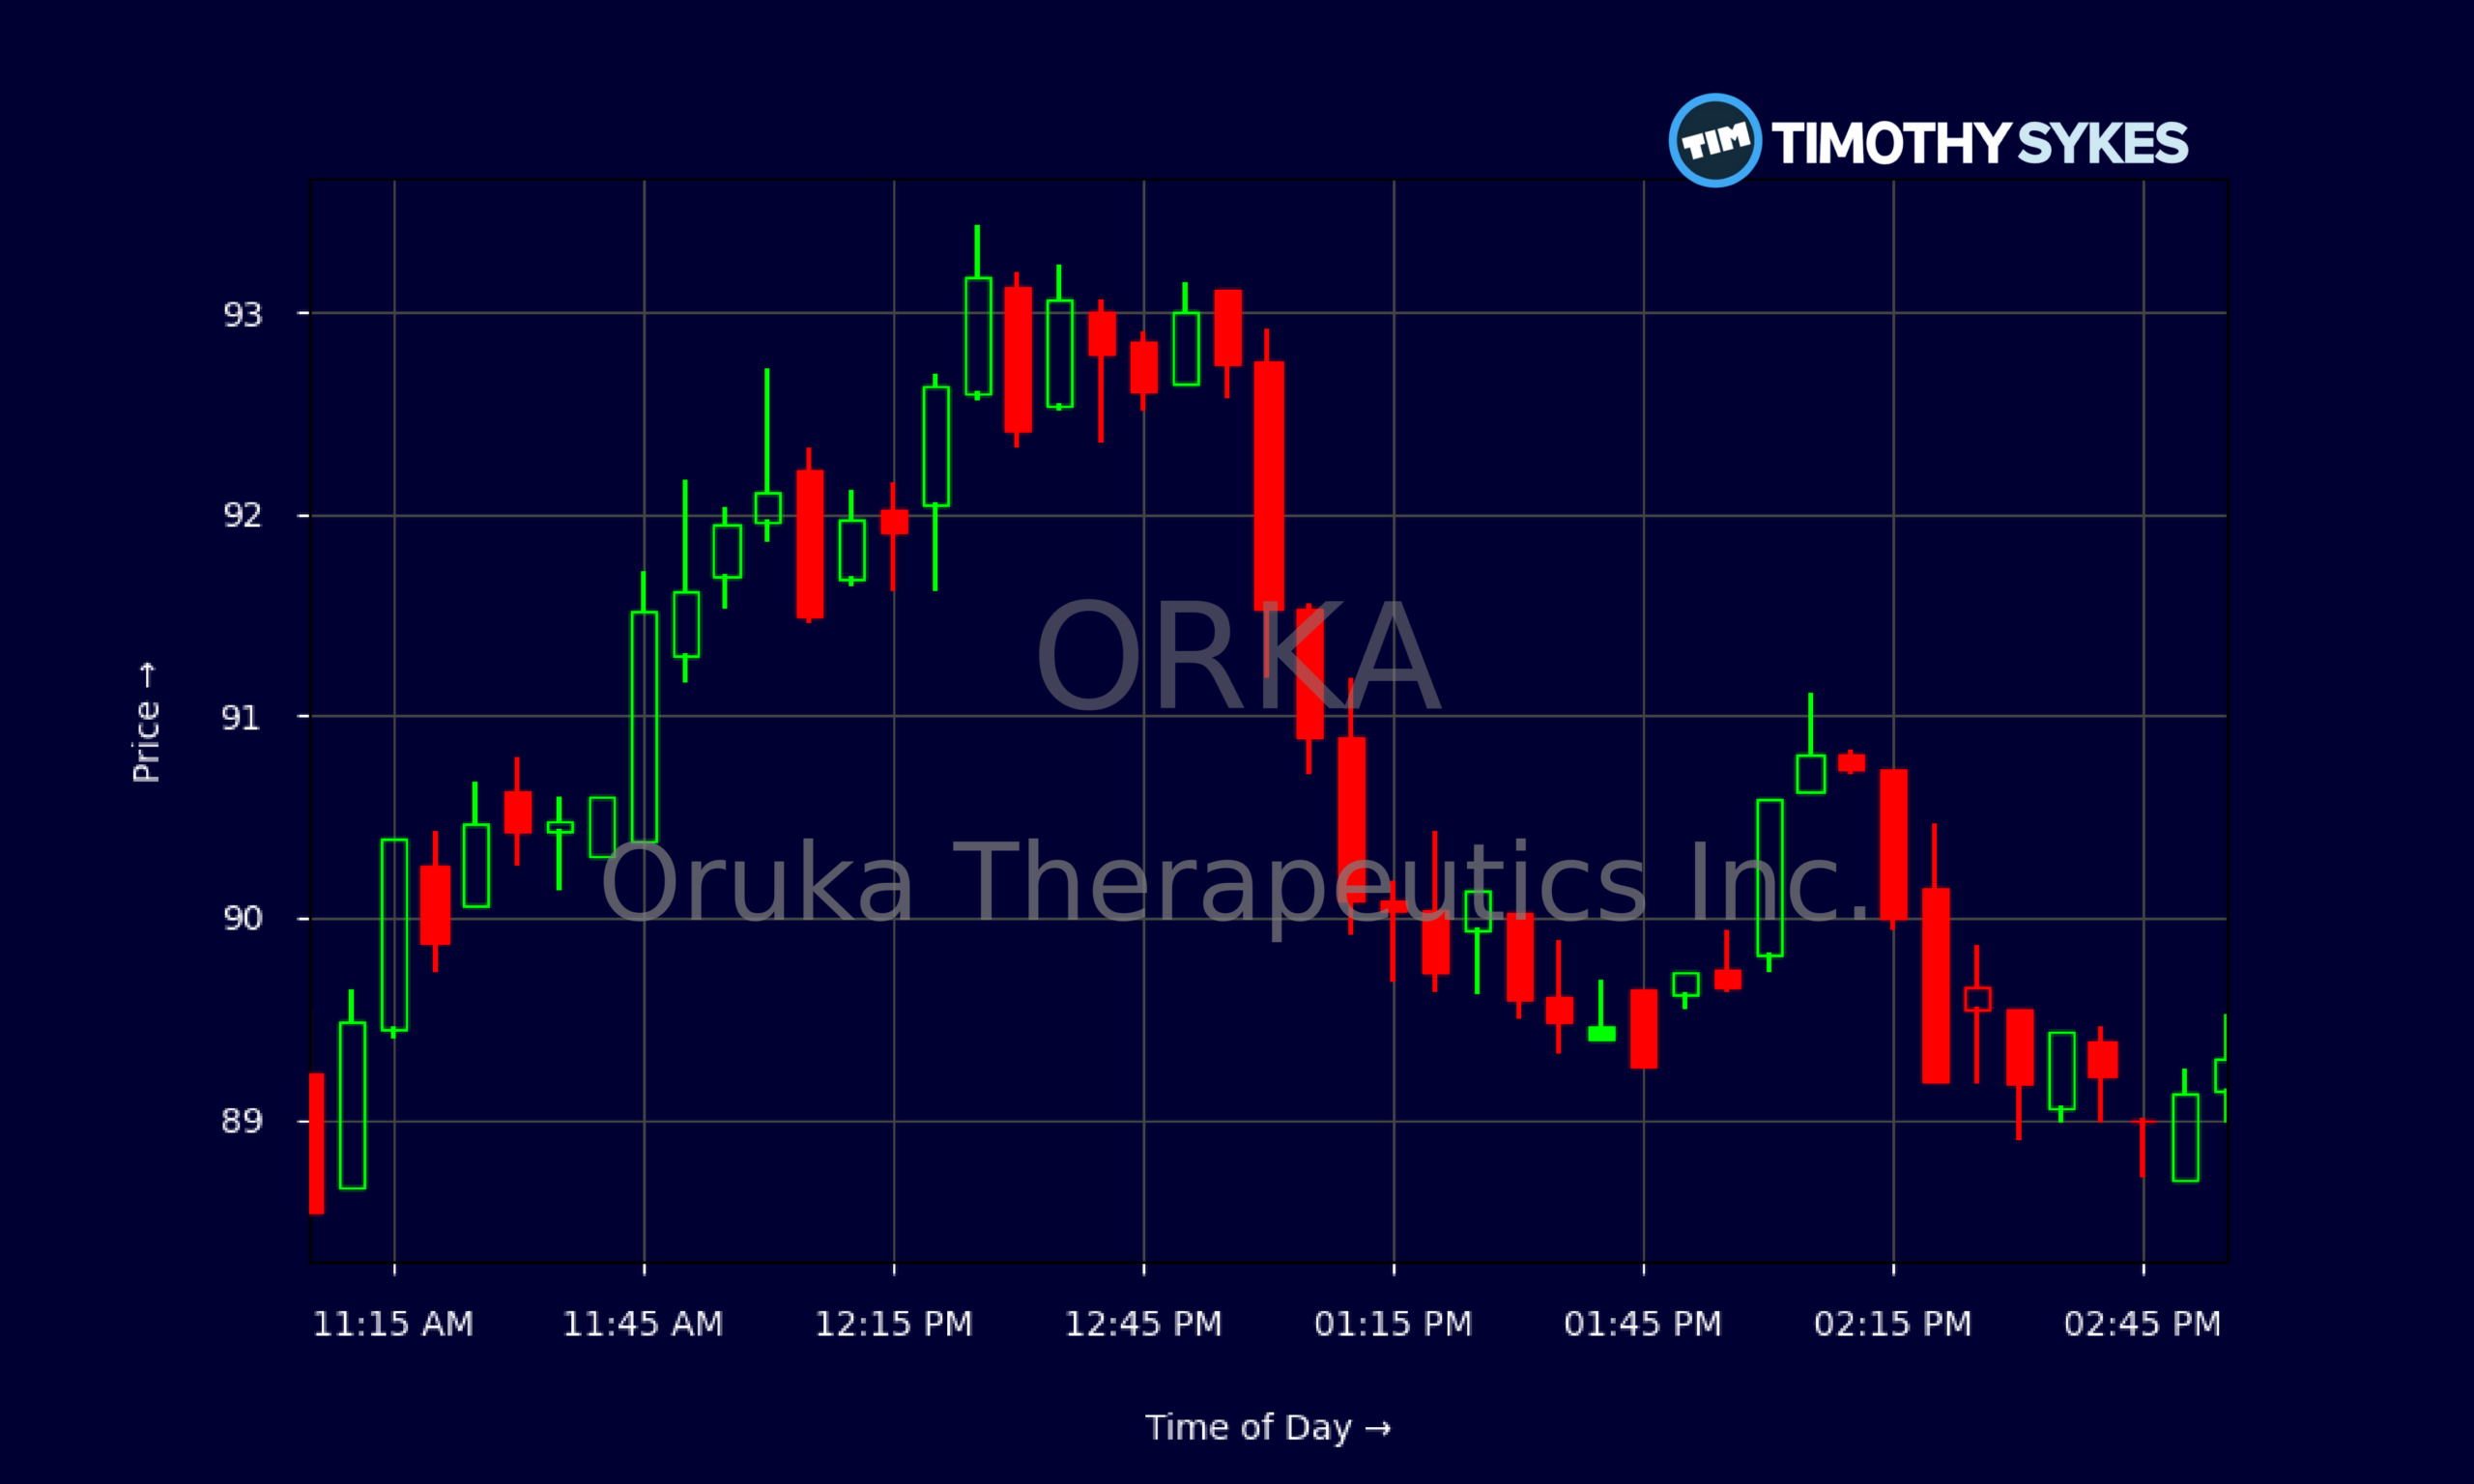
Live Update At 15:02:11 EDT: On Monday, October 26, 2026 Oruka Therapeutics Inc. stock [NASDAQ: ORKA] is trending up by 11.33%! Discover the key drivers behind this movement as well as our expert analysis in the detailed breakdown below.
Quick Financial Overview
ORKA is trading like a story stock backed by a serious balance sheet. Over the last few weeks, Oruka Therapeutics Inc. has pushed from a close near $71.93 to about $89.23, a strong percentage move for a biotech-style name. That steady climb on the daily chart tells traders one thing: dip buyers have been active and patient sellers have not yet taken control.
Under the hood, ORKA’s fundamentals explain why many short sellers stay cautious. Oruka Therapeutics Inc. is sitting on about $873.6M in cash and short-term investments, with total liabilities of only $27.8M and no meaningful long-term debt. The current ratio is an eye-popping 38.5, signaling deep liquidity and a long operational runway.
More Breaking News
But ORKA is far from profitable. Oruka Therapeutics Inc. posted a quarterly net loss of about $41.2M and free cash flow of roughly -$33.1M. Return on equity is about -13.6%, and return on assets is -13.2%. In simple terms, ORKA spends a lot to chase its pipeline. That mix — big cash, big burn, and negative earnings — often attracts momentum traders hunting explosive moves both long and short.
Why Traders Are Watching ORKA Price Action
ORKA has been grinding higher with impressive consistency, and that alone pulls in active traders. On the multi‑day chart, Oruka Therapeutics Inc. bounced from around $72–$75 support in mid‑month and has stair‑stepped higher, printing higher lows almost every day. Moves from $74.42 up toward $89+ represent a sizable trend, especially for short-term trading accounts.
Today’s intraday tape shows how ORKA is behaving in real time. The stock opened around $81.98, ripped into the mid‑$80s within the first hour, then kept pushing into the low $90s by midday. From there, Oruka Therapeutics Inc. started to cool off and consolidate between roughly $89 and $91. That’s the classic pattern where early longs lock in partial gains while new traders test dips.
This kind of controlled consolidation near the top of the day’s range often matters more than any headline. It tells traders that ORKA’s buyers are not panicking on small pullbacks. The 5‑minute candles around $89–$90 are tight, with wicks on both sides, signaling a temporary tug of war instead of a clear reversal.
At the same time, the fundamentals of Oruka Therapeutics Inc. add fuel to the narrative. ORKA has over $268.5M in plain cash and more than $252M in additional investments on the balance sheet, offset by almost no debt. That gives the company flexibility to keep funding research and development — about $43.3M last quarter alone. For traders, that means the story has time to play out, which often supports strong trend moves when sentiment leans bullish.
Conclusion
ORKA sits in a sweet spot for active traders: strong uptrend, thick cash cushion, and no profit yet. Oruka Therapeutics Inc. is clearly still in build‑out mode, burning over $30M in free cash flow in the latest quarter and posting a loss per share of about -$0.55. Those red numbers keep longer‑term money cautious, but they also amplify every shift in sentiment, which is exactly what short‑term traders look to exploit.
The balance sheet changes the risk calculus. With more than $873.6M in cash and short-term investments against modest liabilities, Oruka Therapeutics Inc. is not trading like a company on life support. ORKA has room to absorb several more quarters of aggressive R&D spending without needing to rush back to the market. That dynamic often underpins extended multi‑month trends, because dilution fears are present but not urgent.
For traders in the Sykes and StocksToTrade universe, the playbook around ORKA is straightforward: map the levels, respect the volatility, and react, not predict. As millionaire penny stock trader and teacher Tim Sykes says, “You must adapt to the market; the market will not adapt to you.”. Tim Sykes likes to remind traders, “The market doesn’t care about your opinion, only your reaction. Trade the price action, not the story you tell yourself.” With ORKA pushing toward fresh highs on rising volume and a massive cash pile behind it, the price action is the story. The key is treating Oruka Therapeutics Inc. as a trading vehicle, not a long-term promise — and cutting losses fast if the trend finally snaps.
This is stock news, not investment advice. Timothy Sykes News delivers real-time stock market news focused on key catalysts driving short-term price movements. Our content is tailored for active traders and investors seeking to capitalize on rapid price fluctuations, particularly in volatile sectors like penny stocks. Readers come to us for detailed coverage on earnings reports, mergers, FDA approvals, new contracts, and unusual trading volumes that can trigger significant short-term price action. Some users utilize our news to explain sudden stock movements, while others rely on it for diligent research into potential investment opportunities.
Dive deeper into the world of trading with Timothy Sykes, renowned for his expertise in penny stocks. Explore his top picks and discover the strategies that have propelled him to success with these articles:
- Penny Stocks Trading Guide
- Best Penny Stocks Under $1 to Buy Today
- Top 8 Penny Stocks to Watch on Robinhood
Once you’ve got some stocks on watch, elevate your trading game with StocksToTrade the ultimate platform for traders. With specialized tools for swing and day trading, StocksToTrade will guide you through the market’s twists and turns.
Dig into StocksToTrade’s watchlists here:





Leave a reply