

Flagstar Bank N.A. stocks have been trading down by -9.08 percent following heightened concerns over its regional banking exposure.
What Traders Need To Know
- Shares sank more than 9% after Q3 results came in below analyst expectations, signaling sharp disappointment.
- The stock dropped about 8% on adjusted earnings and revenue misses, pointing to pressure across the income statement.
- BofA highlighted Flagstar Bank N.A. as leading mid‑cap lenders in downward Q3 EPS revisions, flagging higher earnings risk.
- U.S. regional banks as a group face tough macro headwinds, with BofA expecting the space to “languish” into Q3 earnings.
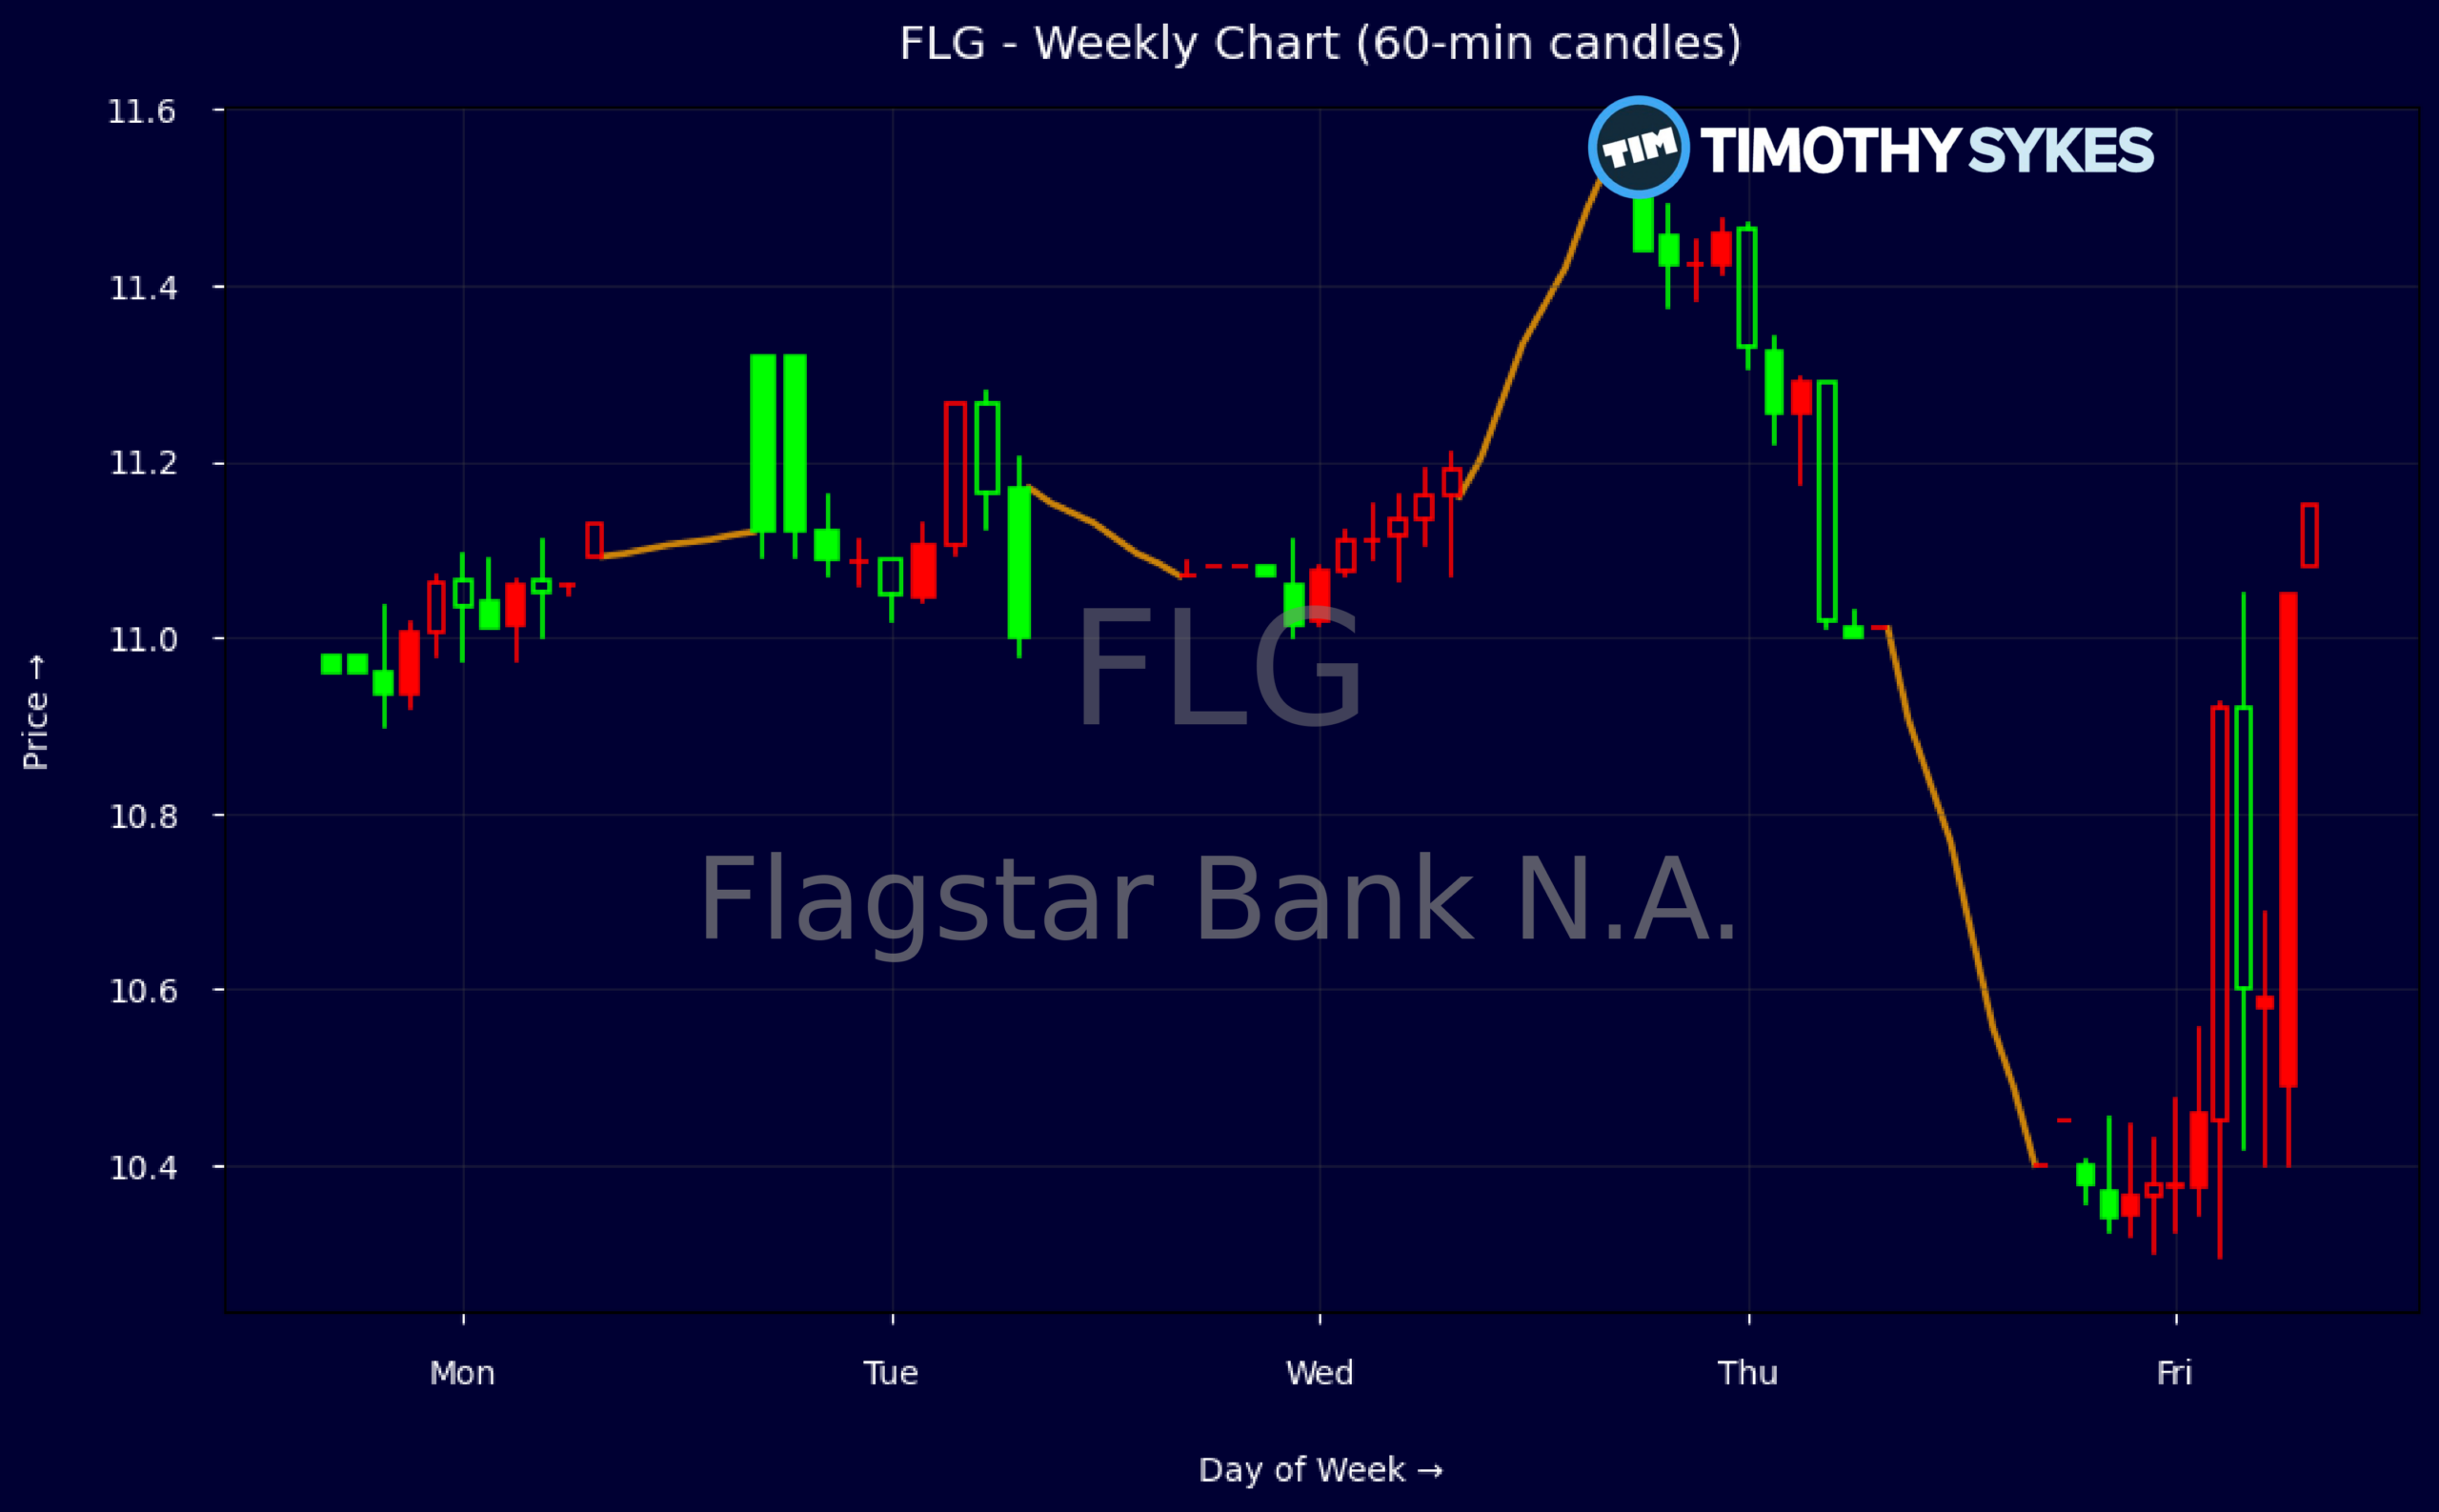
Weekly Update Oct 19 – Oct 23, 2026: On Sunday, October 25, 2026 Flagstar Bank N.A. stock [NYSE: FLG] is trending down by -9.08%! Discover the key drivers behind this movement as well as our expert analysis in the detailed breakdown below.
Finance industry expert:
Analyst sentiment – negative
Flagstar (FLG) is a subscale regional lender with weak profitability and an asset‑heavy, low‑return balance sheet. EBIT and pretax margins are negative, and ROA is just ~0.02% versus 0.8–1.0% for quality regionals, despite positive net income. Revenue has contracted sharply over three years (‑22%) and capital allocation is inefficient, with P/E at 283x on depressed earnings but P/B only 0.62x, reflecting skepticism about earnings quality and asset risk. Leverage is high (D/E 1.43x; leverage ratio 11.5x), and dividend capacity is negligible given steep dividend cuts.
Technically, the tape shows failed upside follow‑through and emerging downside pressure. The weekly range from 10.96–11.54 broke higher mid‑week (close 11.54) but reversed violently to 10.40, forming a shooting‑star‑type rejection near 11.50 resistance. Intraday 5‑minute action confirms heavy supply above 11.30 with rising sell volume into the close. Dominant trend is now short‑term down within a broader sideways band. A clear actionable level is 10.30–10.40: a break and hold below 10.30 opens 9.75–10.00; resistance remains 11.50.
Fundamentally and thematically, FLG is weaker than the regional bank group, which already faces macro headwinds and muted valuation support. The Q3 earnings miss, double‑digit share price drop, and BofA’s leading negative EPS revisions underscore above‑average earnings risk and limited capital flexibility versus peers and benchmarks like KRE and BKX. I expect underperformance to continue. Tactical traders should sell rallies into 11.30–11.50 with a medium‑term target around 9.75 and key support at 10.00; sustained reclaim of 11.50 would invalidate.
More Breaking News
Quick Financial Overview
Flagstar Bank N.A. (FLG) just took a hard hit after Q3 numbers missed Street expectations, triggering a 9%+ selloff. That reaction lines up with a name already flagged by BofA for leading downward Q3 EPS revisions among mid‑cap lenders. In other words, the bar was low and FLG still could not clear it. For short‑term traders, that often marks a sentiment break rather than a simple one‑day overreaction.
On the weekly tape, FLG traded as high as roughly $11.54 before sliding to near $10.40, showing a sharp reversal from a brief push higher. That drop, coinciding with the earnings miss headlines, confirms sellers are in control near the mid‑$11s for now. The intraday 5‑minute candle around the news shows a wide range, with a spike up toward $11.05 followed by a flush down near $10.30 and a weak close around $10.38. That kind of failed pop and heavy fade tells you liquidity was used to exit, not build, positions.
Under the hood, FLG is a low‑valuation regional bank on classic metrics, but with thin profitability. Revenue sits around $2.06B, yet pretax margins are negative and the P/E ratio screens extremely high at about 283, reflecting very small current earnings rather than a growth premium. Price‑to‑book near 0.62 and price‑to‑tangible‑book near 0.64 say the market still discounts the balance sheet despite book value per share of about $18.40. Leverage is typical for a bank, with a total debt‑to‑equity ratio around 1.43 and a high balance‑sheet lever at 11.5 times, which limits room for error if credit costs or funding pressures rise.
Conclusion
This is stock news, not investment advice. Timothy Sykes News delivers real-time stock market news focused on key catalysts driving short-term price movements. Our content is tailored for active traders and investors seeking to capitalize on rapid price fluctuations, particularly in volatile sectors like penny stocks. Readers come to us for detailed coverage on earnings reports, mergers, FDA approvals, new contracts, and unusual trading volumes that can trigger significant short-term price action. Some users utilize our news to explain sudden stock movements, while others rely on it for diligent research into potential investment opportunities.
Dive deeper into the world of trading with Timothy Sykes, renowned for his expertise in penny stocks. Explore his top picks and discover the strategies that have propelled him to success with these articles:
- Penny Stocks Trading Guide
- Best Penny Stocks Under $1 to Buy Today
- Top 8 Penny Stocks to Watch on Robinhood
Once you’ve got some stocks on watch, elevate your trading game with StocksToTrade the ultimate platform for traders. With specialized tools for swing and day trading, StocksToTrade will guide you through the market’s twists and turns.
Dig into StocksToTrade’s watchlists here:





Leave a reply