

Inter & Co. Inc. shares face added pressure from weakening Brazilian fintech demand, as stocks have been trading down by -38.26 percent.
Key Takeaways
- Price action in INTR shows a steady grind higher from the mid-$5s to above $7, signaling growing interest from active traders.
- Recent intraday trading in Inter & Co. Inc. has tightened into a narrow band, hinting at a potential breakout or breakdown setup.
- Financials show INTR with roughly $98.6B in total assets and over $11.6B in cash, giving the bank room to maneuver.
- Profitability remains thin, but positive return on equity tells traders Inter & Co. Inc. is squeezing earnings from its capital base.
- With a price-to-sales ratio near 2 and price-to-book around 1.7, traders see INTR as a mid-range valuation story tied to execution.
Live Update At 09:19:20 EDT: On Monday, October 26, 2026 Inter & Co. Inc. stock [NASDAQ: INTR] is trending down by -38.26%! Discover the key drivers behind this movement as well as our expert analysis in the detailed breakdown below.
Quick Financial Overview
Inter & Co. Inc., the parent behind INTR, is a Brazilian digital-first bank with real scale. The latest balance sheet shows about $98.6B in total assets and roughly $45.3B in net loans. That tells traders this is not a micro-cap fintech experiment — it is a full banking platform with credit exposure and funding complexity.
Cash and cash equivalents sit near $11.7B, plus around $29.0B in securities and investments. For traders in INTR, that liquidity stack matters. It shows Inter & Co. Inc. has firepower to fund growth and absorb shocks, even if credit cycles get rough.
Profitability is still ramping. The reported pretax profit margin sits around -2.3%, but return on equity is about 8% and return on assets is 1%. In banking, that ROA line is key. A positive number, even small, means the core machine is working.
More Breaking News
On valuation, INTR trades around 2.07 times sales and roughly 1.71 times book value, with tangible book closer to 2.13 times. For a growing digital bank, that puts Inter & Co. Inc. in the “prove it” zone — not dirt cheap, not bubble territory. Traders are watching to see if earnings growth can catch up to the balance sheet.
Why Traders Are Watching INTR Price Action
The chart is where the story gets interesting. Over the last several sessions, INTR has pushed from about $5.30 on 2026/10/01 up toward $7.19 by 2026/10/23. That is a strong percentage run in a short window. For traders who live on momentum, Inter & Co. Inc. has been a clean uptrend with healthy pullbacks.
Look at the daily candles. Early October shows a launch from the low-$5s to the mid-$6s by 2026/10/05. Then INTR spent several days grinding between roughly $6.50 and $7.80, with multiple tests of the $7 area. This kind of stair-step pattern — push, consolidate, push again — often signals steady accumulation rather than wild pump-and-dump action.
INTR’s highs near $7.81 on 2026/10/12 and closes holding above $7.00 on most days since 2026/10/07 suggest dip buyers are active. Even the red days, like the drop from $7.06 open to $6.74 close on 2026/10/22, stayed inside the broader uptrend channel. Traders watching Inter & Co. Inc. see support building around $6.70–$6.90.
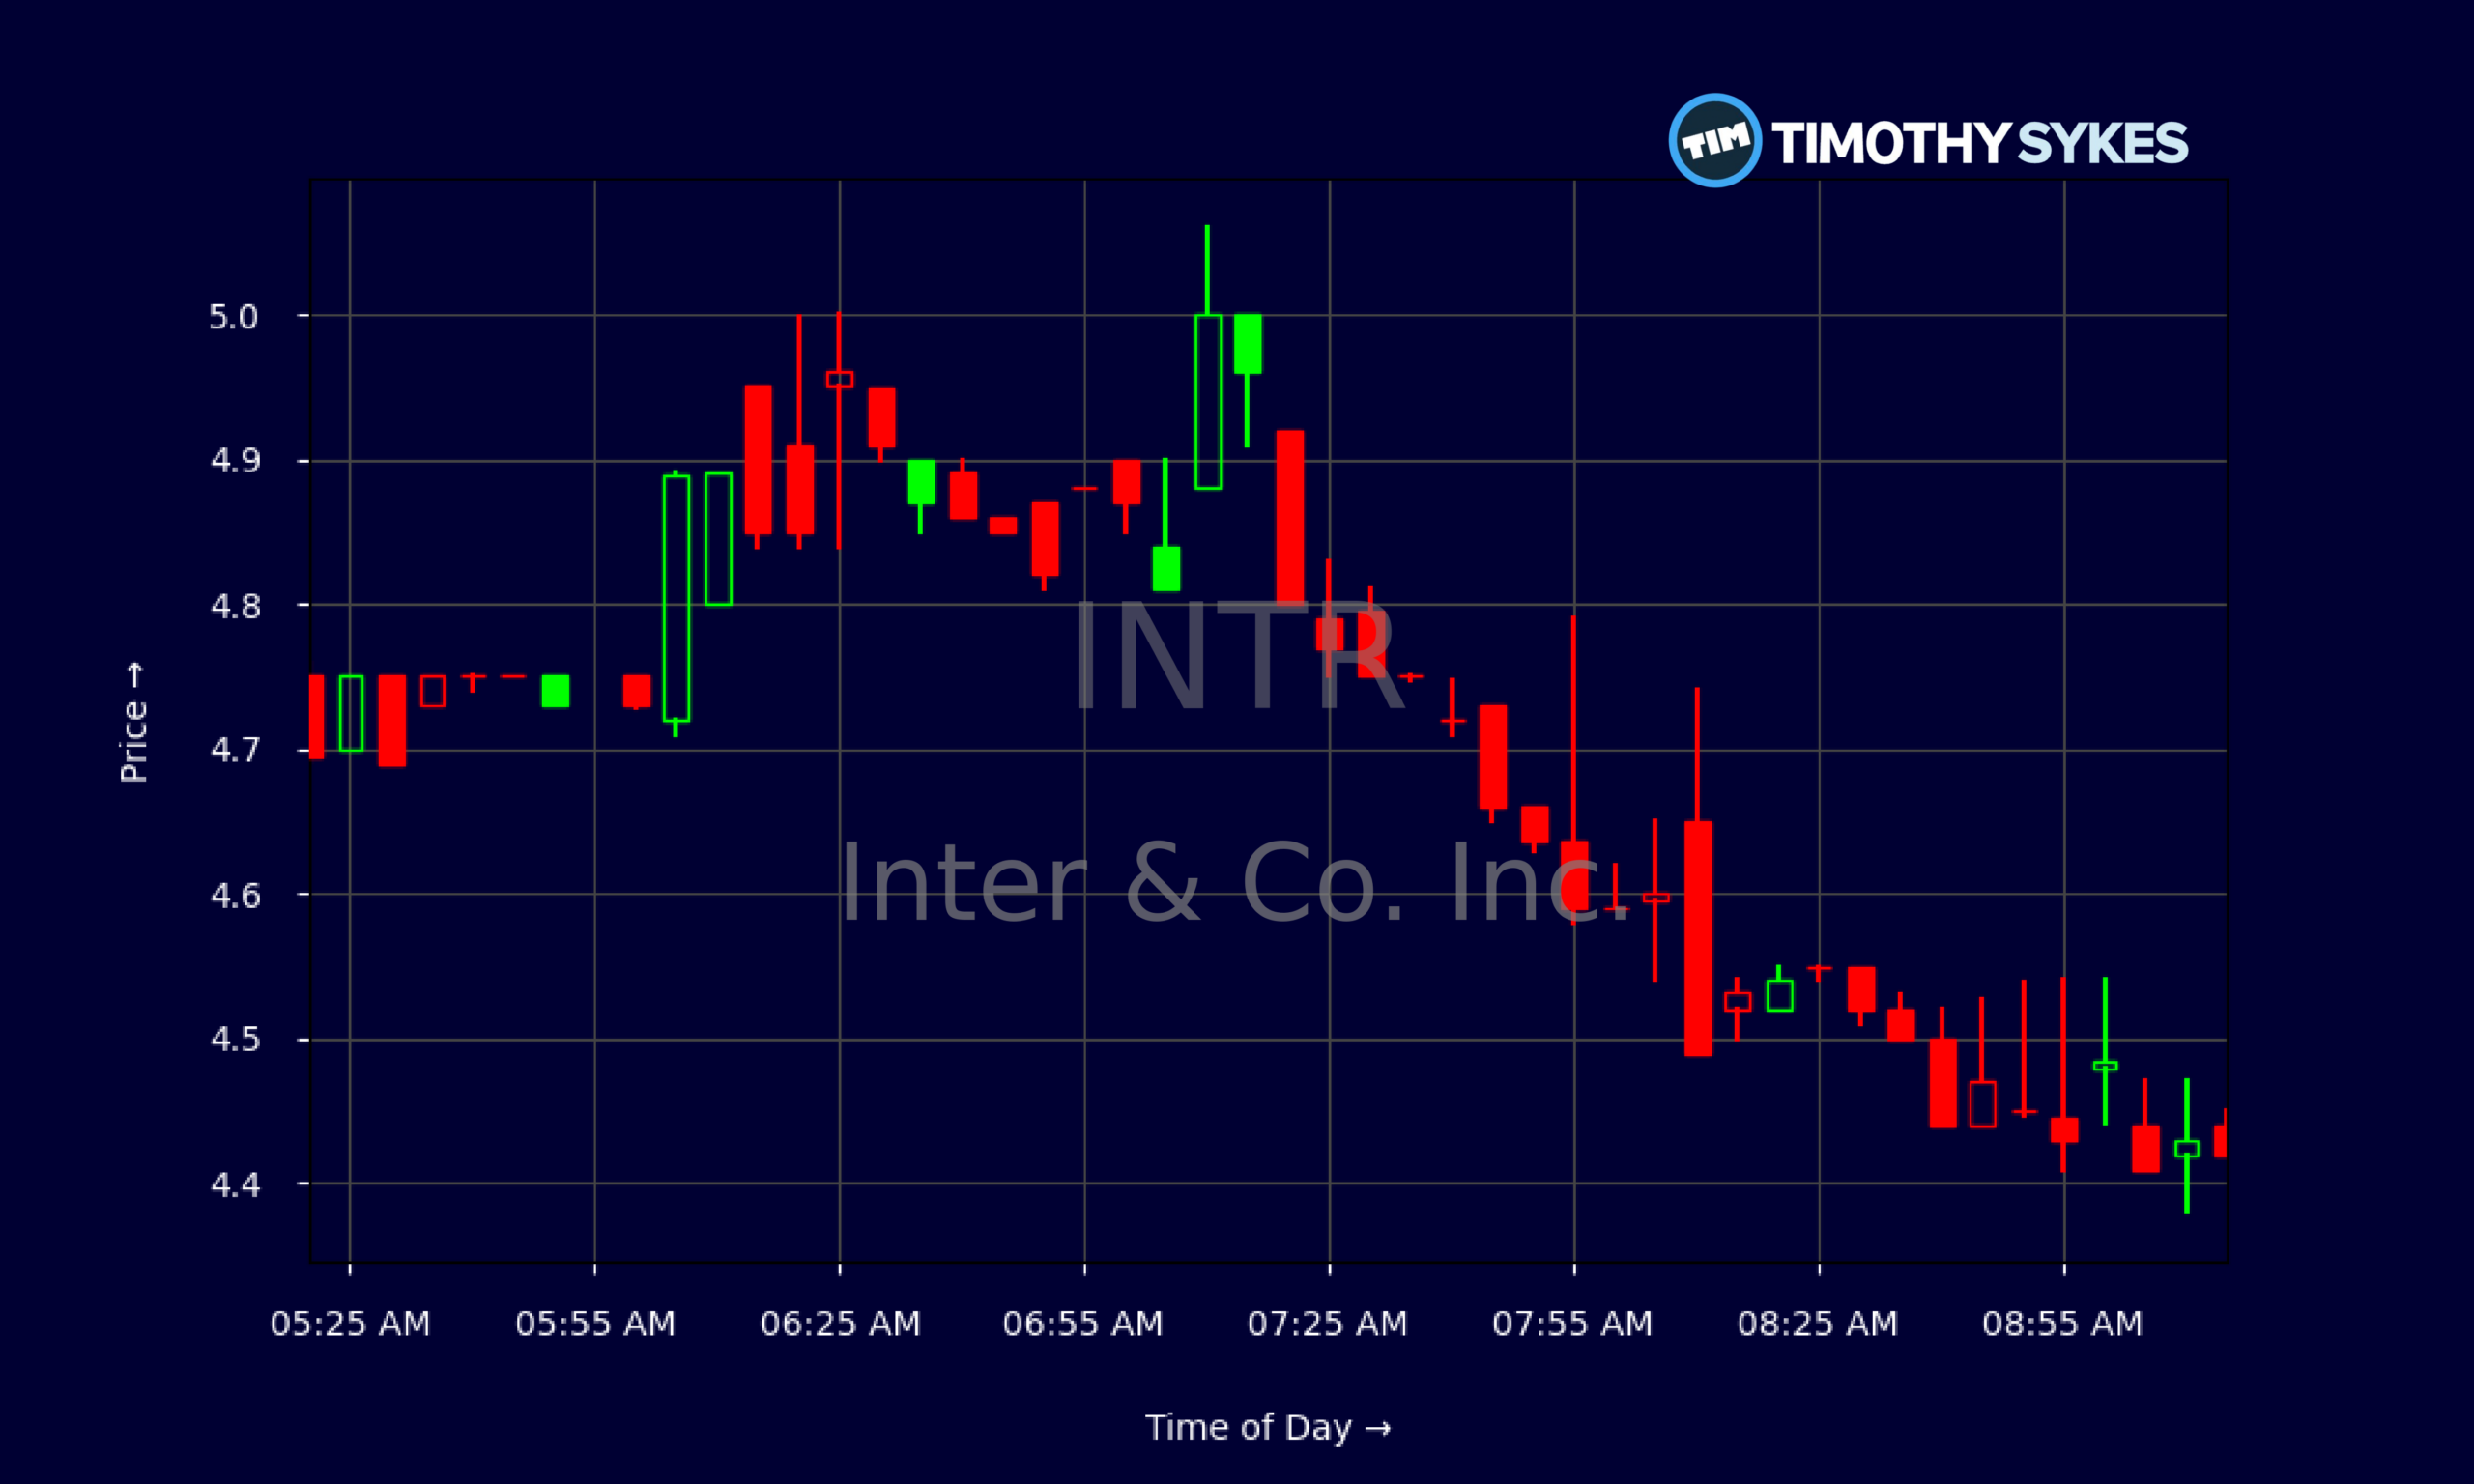
Intraday, the 5‑minute data tells a different story: compression. Early in the session, INTR traded as high as about $5.85 at 04:00, then faded into the mid-$4s and chopped between roughly $4.40 and $4.90 for hours. That shift from a wide early range to a tight band shows supply and demand balancing out. For short-term traders, this is the classic coiled-spring look; they are now waiting for volume to pick a direction.
Combine that with the solid asset base and moderate valuation, and INTR becomes a watchlist name. Not a hype story — a real bank with a tradable chart.
Conclusion
For active traders, INTR sits at a crossroads. The bigger trend in Inter & Co. Inc. has been up, powered by that move from the mid-$5s to above $7. Yet the intraday tape shows a market catching its breath, consolidating between the mid-$4s and just under $5 in recent action. When price flattens after a strong run, the next move usually sets the tone for weeks.
The fundamentals back that tension. Inter & Co. Inc. runs with high leverage, as most banks do, at around 9.7 times, but posts positive return on equity and a slim positive return on assets. Revenue of about $8.4B, combined with a price-to-sales ratio near 2, tells traders they are paying a fair — not crazy — multiple for growth potential.
For newer traders studying INTR, this is a live case study in how price, volume, and fundamentals line up. The key is discipline. As Tim Sykes always says, “Trade like a sniper, not a machine gunner. Wait for the best setups, then strike with a plan and clear risk.” As millionaire penny stock trader and teacher Tim Sykes, says, “There is always another play around the corner; don’t chase just because you feel FOMO.”. That mindset helps traders stay patient and avoid forcing trades when the setup isn’t truly there.
Applied to Inter & Co. Inc., that means mapping support near $6.70–$6.90, watching resistance in the low-$7s, and only trading INTR when the stock breaks from this tight range on real volume. This article is for educational and research purposes only, and every trader must decide for themselves how, or whether, to trade INTR.
This is stock news, not investment advice. Timothy Sykes News delivers real-time stock market news focused on key catalysts driving short-term price movements. Our content is tailored for active traders and investors seeking to capitalize on rapid price fluctuations, particularly in volatile sectors like penny stocks. Readers come to us for detailed coverage on earnings reports, mergers, FDA approvals, new contracts, and unusual trading volumes that can trigger significant short-term price action. Some users utilize our news to explain sudden stock movements, while others rely on it for diligent research into potential investment opportunities.
Dive deeper into the world of trading with Timothy Sykes, renowned for his expertise in penny stocks. Explore his top picks and discover the strategies that have propelled him to success with these articles:
- Penny Stocks Trading Guide
- Best Penny Stocks Under $1 to Buy Today
- Top 8 Penny Stocks to Watch on Robinhood
Once you’ve got some stocks on watch, elevate your trading game with StocksToTrade the ultimate platform for traders. With specialized tools for swing and day trading, StocksToTrade will guide you through the market’s twists and turns.
Dig into StocksToTrade’s watchlists here:





Leave a reply