
NRX Pharmaceuticals Inc. stocks have been trading down by -16.92 percent after news highlighting intensified operational and financing risks.
Market Insights For Active NRXP Traders
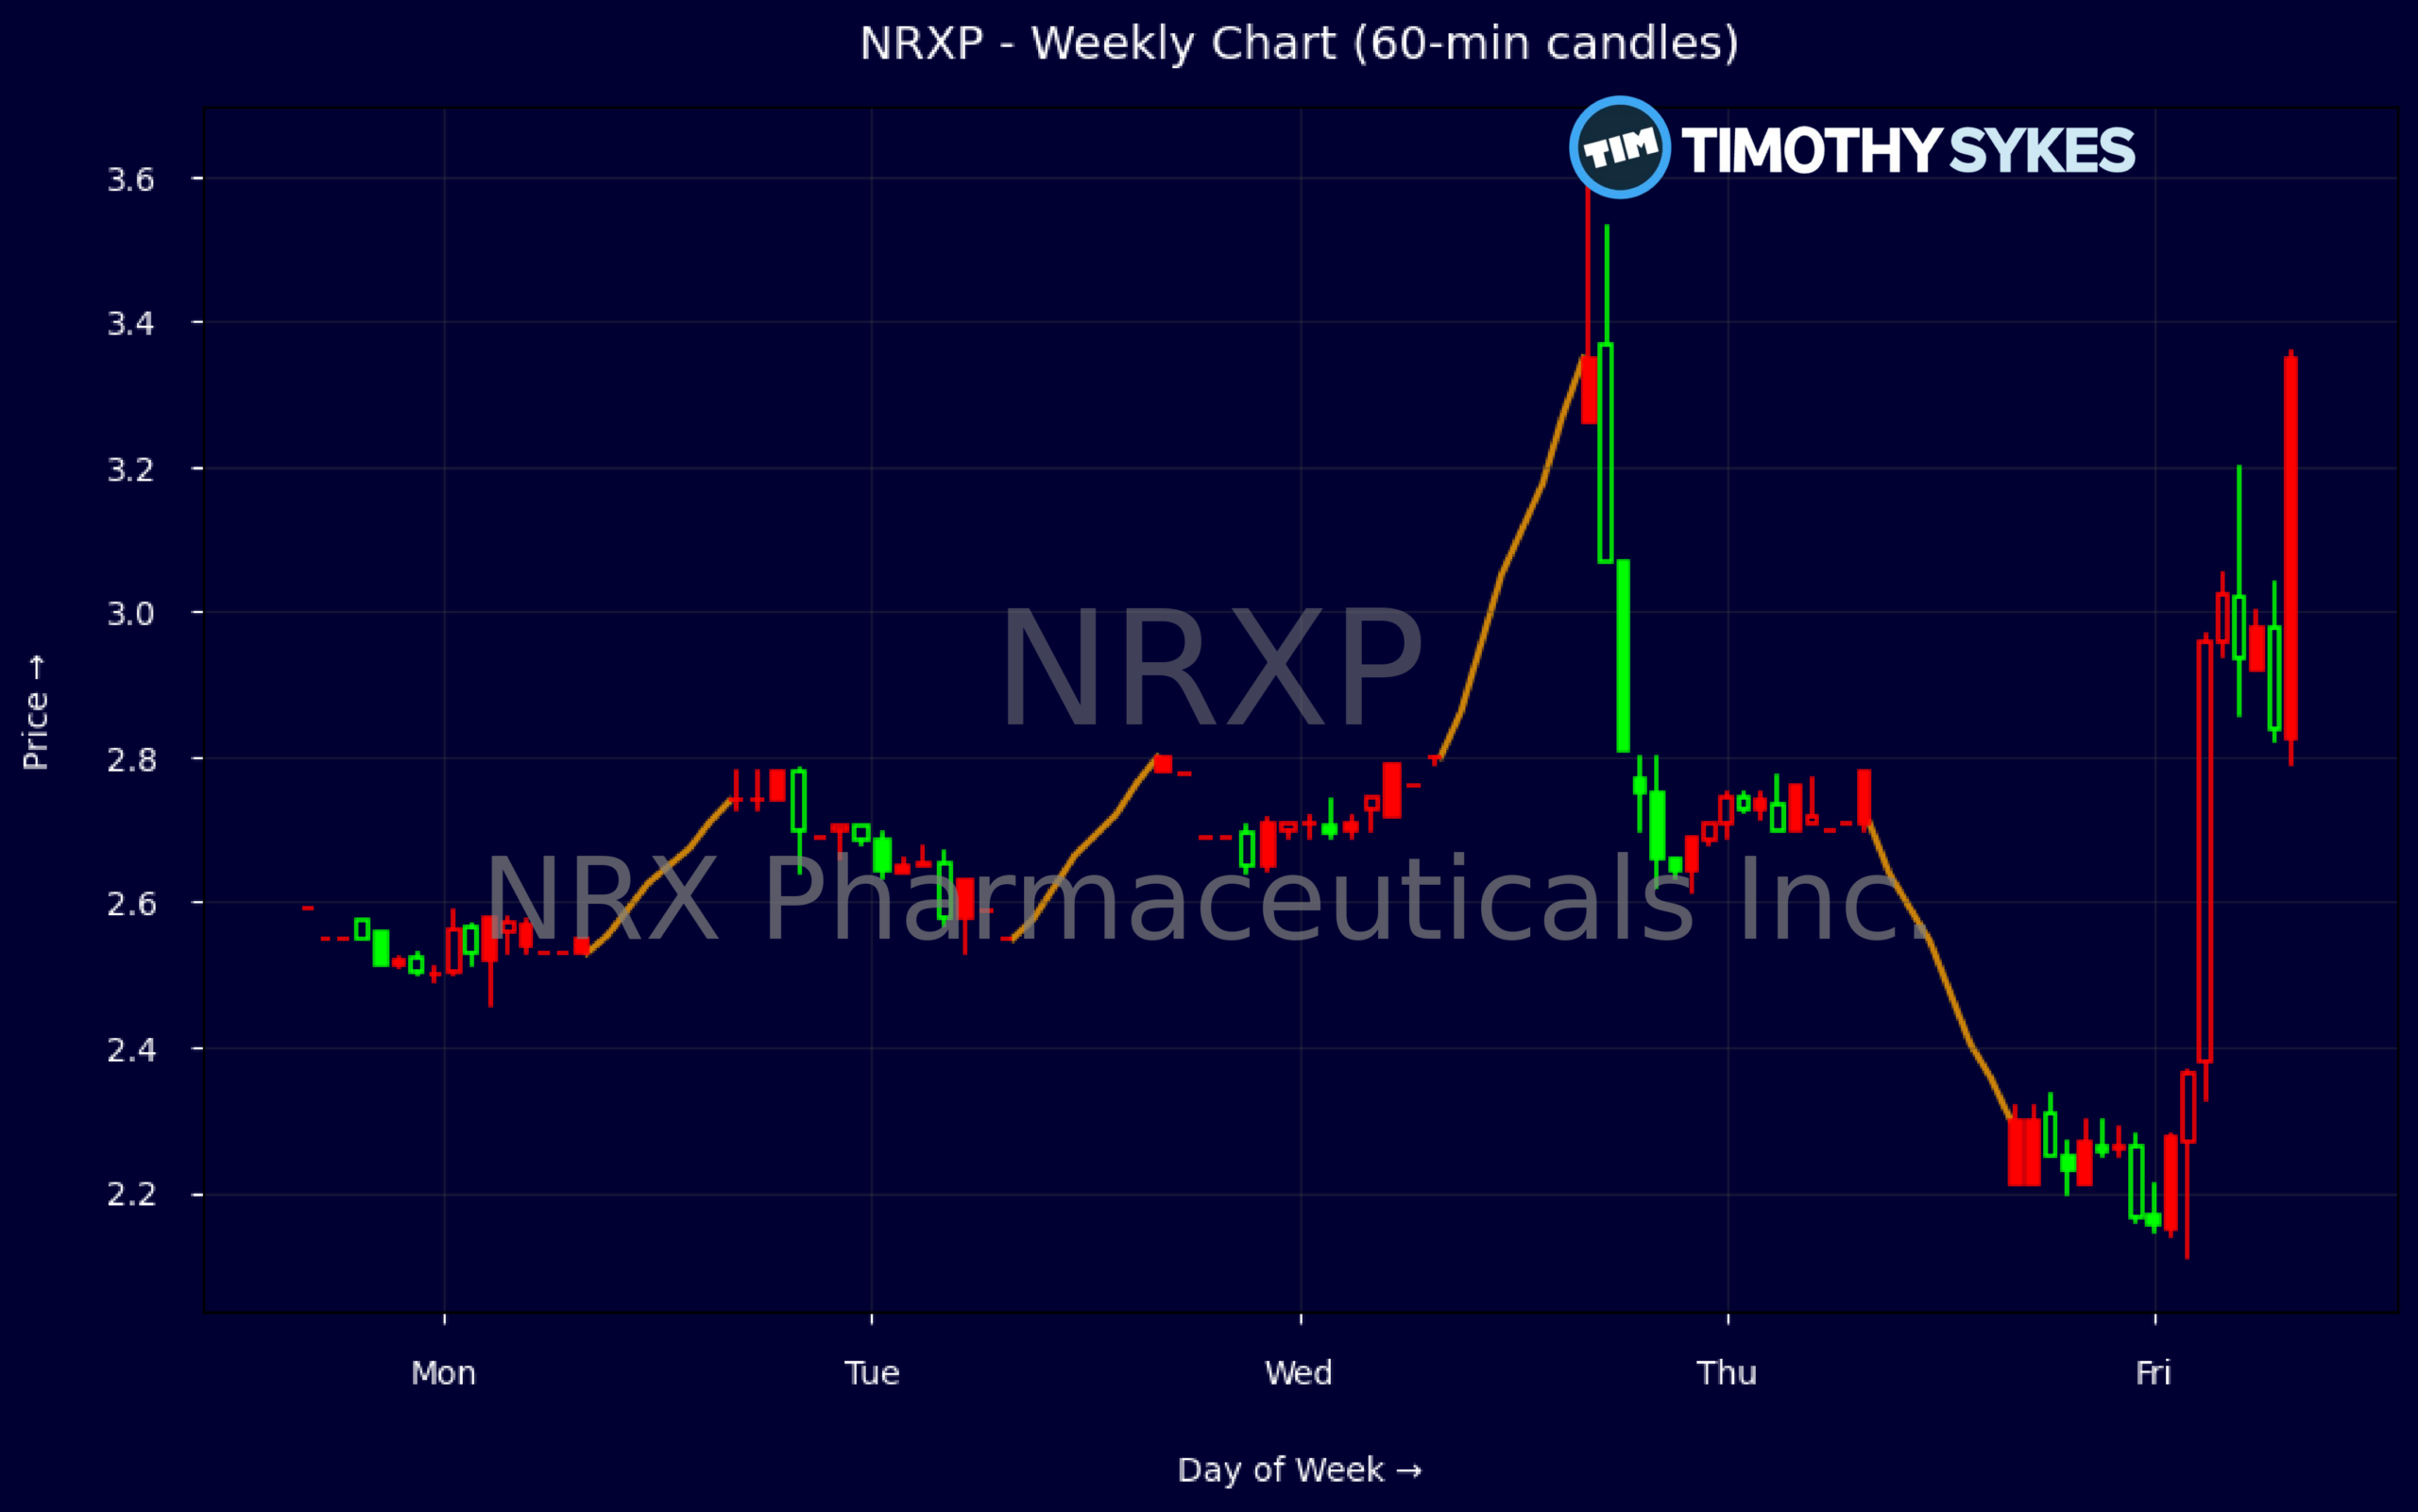
- Price has fallen from a recent push above $3.60 to around the low $2s, signaling heavy selling pressure after a brief spike.
- Intraday action shows a sharp drop from the high $2s into the low $2s, highlighting weak demand on shorter timeframes.
- Financials reveal steep losses and negative equity, putting NRX Pharmaceuticals Inc. firmly in high-risk territory.
- Cash on hand is sizable relative to revenue, giving NRXP some operational runway despite ongoing cash burn.
- Valuation multiples look stretched against small revenue, so traders are likely to focus more on momentum and catalysts than fundamentals.
Weekly Update Oct 26 – Oct 30, 2026: On Saturday, October 31, 2026 NRX Pharmaceuticals Inc. stock [NASDAQ: NRXP] is trending down by -16.92%! Discover the key drivers behind this movement as well as our expert analysis in the detailed breakdown below.
Healthcare industry expert:
Analyst sentiment – negative
NRx Pharmaceuticals (NRXP) is an early-stage CNS-focused biotech with negligible revenue ($1.1M quarterly) and extreme unprofitability (EBIT margin ~-700%, ROA below -100%), reflecting a pre-commercial, capital-dependent model. Cash of ~$26.7M and recent financing inflows (~$29.5M) extend runway but sit against negative equity and working capital (-$4.7M), underscoring balance-sheet fragility. High price-to-sales (~36x) with no earnings support leaves the equity highly speculative and entirely contingent on pipeline inflection.
Technically, NRXP has shifted from a brief upside spike to immediate weakness. The weekly sequence shows a surge to 3.62 followed by a sharp drop to a 2.21 close, leaving a long upper shadow that confirms supply above 3.25–3.60. Short-term 5‑minute action (thin, volatile candles, elevated volume on down moves) indicates distribution, not accumulation. The actionable level is $2.20–2.25: below this band, the setup favors short or avoidance; above $2.80, aggressive traders can target a gap fill toward $3.25.
With no new fundamental news, NRXP trades as a binary pipeline and financing story, lagging broader Healthcare and Biotechnology & Life Sciences indices on risk-adjusted metrics. Its negative equity, heavy losses, and dependence on capital place it below sector quality benchmarks despite a decent gross margin profile on minimal revenue. Near-term resistance sits at $2.80 then $3.25; support is around $2.20. Absent clear clinical or partnership catalysts, the risk/reward is unfavorable, and the stock is a sell below $2.50.
More Breaking News
Quick Financial Overview
NRX Pharmaceuticals Inc. is trading like a classic high-risk, event-driven biotech. The weekly chart shows the stock pushing from the mid-$2s up through $3.60, then breaking down hard back toward the low $2s. That failed breakout and rapid reversal tells traders that overhead supply is strong and that recent buyers above $3 are now trapped and potentially selling into any bounce.
On the intraday 5-minute view, price opened in the high $2s and quickly slid into the low $2s, with very little sign of intraday recovery. This type of one-way move often points to forced selling or a negative shift in sentiment rather than balanced two-sided trade. For short-term traders, it signals caution on chasing strength and puts the focus on whether the stock can stabilize above prior support levels near $2.
Fundamentally, NRXP is a small-revenue company, posting about $1.1M in quarterly revenue and roughly $1.2M on a trailing basis, while recording a net loss of about $16.5M in the latest quarter. Margins are deeply negative, with EBIT and profit margins far below zero, and return on assets also heavily negative. At the same time, NRX Pharmaceuticals Inc. shows cash of about $26.7M against total assets of roughly $34.2M, but stockholders’ equity is slightly negative and working capital is also in the red, pointing to a capital structure that relies on external financing.
Conclusion
This is stock news, not investment advice. Timothy Sykes News delivers real-time stock market news focused on key catalysts driving short-term price movements. Our content is tailored for active traders and investors seeking to capitalize on rapid price fluctuations, particularly in volatile sectors like penny stocks. Readers come to us for detailed coverage on earnings reports, mergers, FDA approvals, new contracts, and unusual trading volumes that can trigger significant short-term price action. Some users utilize our news to explain sudden stock movements, while others rely on it for diligent research into potential investment opportunities.
Dive deeper into the world of trading with Timothy Sykes, renowned for his expertise in penny stocks. Explore his top picks and discover the strategies that have propelled him to success with these articles:
- Penny Stocks Trading Guide
- Best Penny Stocks Under $1 to Buy Today
- Top 8 Penny Stocks to Watch on Robinhood
Once you’ve got some stocks on watch, elevate your trading game with StocksToTrade the ultimate platform for traders. With specialized tools for swing and day trading, StocksToTrade will guide you through the market’s twists and turns.
Dig into StocksToTrade’s watchlists here:





Leave a reply