
Marvell Technology Inc. faces bearish pressure as critical semiconductor demand concerns surface, and stocks have been trading down by -2.59 percent.
Key Takeaways
- MRVL has slid from recent highs above $280 to around $196, signaling a sharp but orderly pullback on the daily chart.
- Strong gross margin above 50% shows Marvell Technology Inc. still prints healthy core profits despite the volatility in its share price.
- Cash of roughly $3.9B and moderate debt levels give MRVL room to keep funding AI and data-center growth without stressing the balance sheet.
- A sky-high P/E above 90 and price-to-sales near 26 keep MRVL firmly in “momentum stock” territory, where sentiment and timing matter more than value screens.
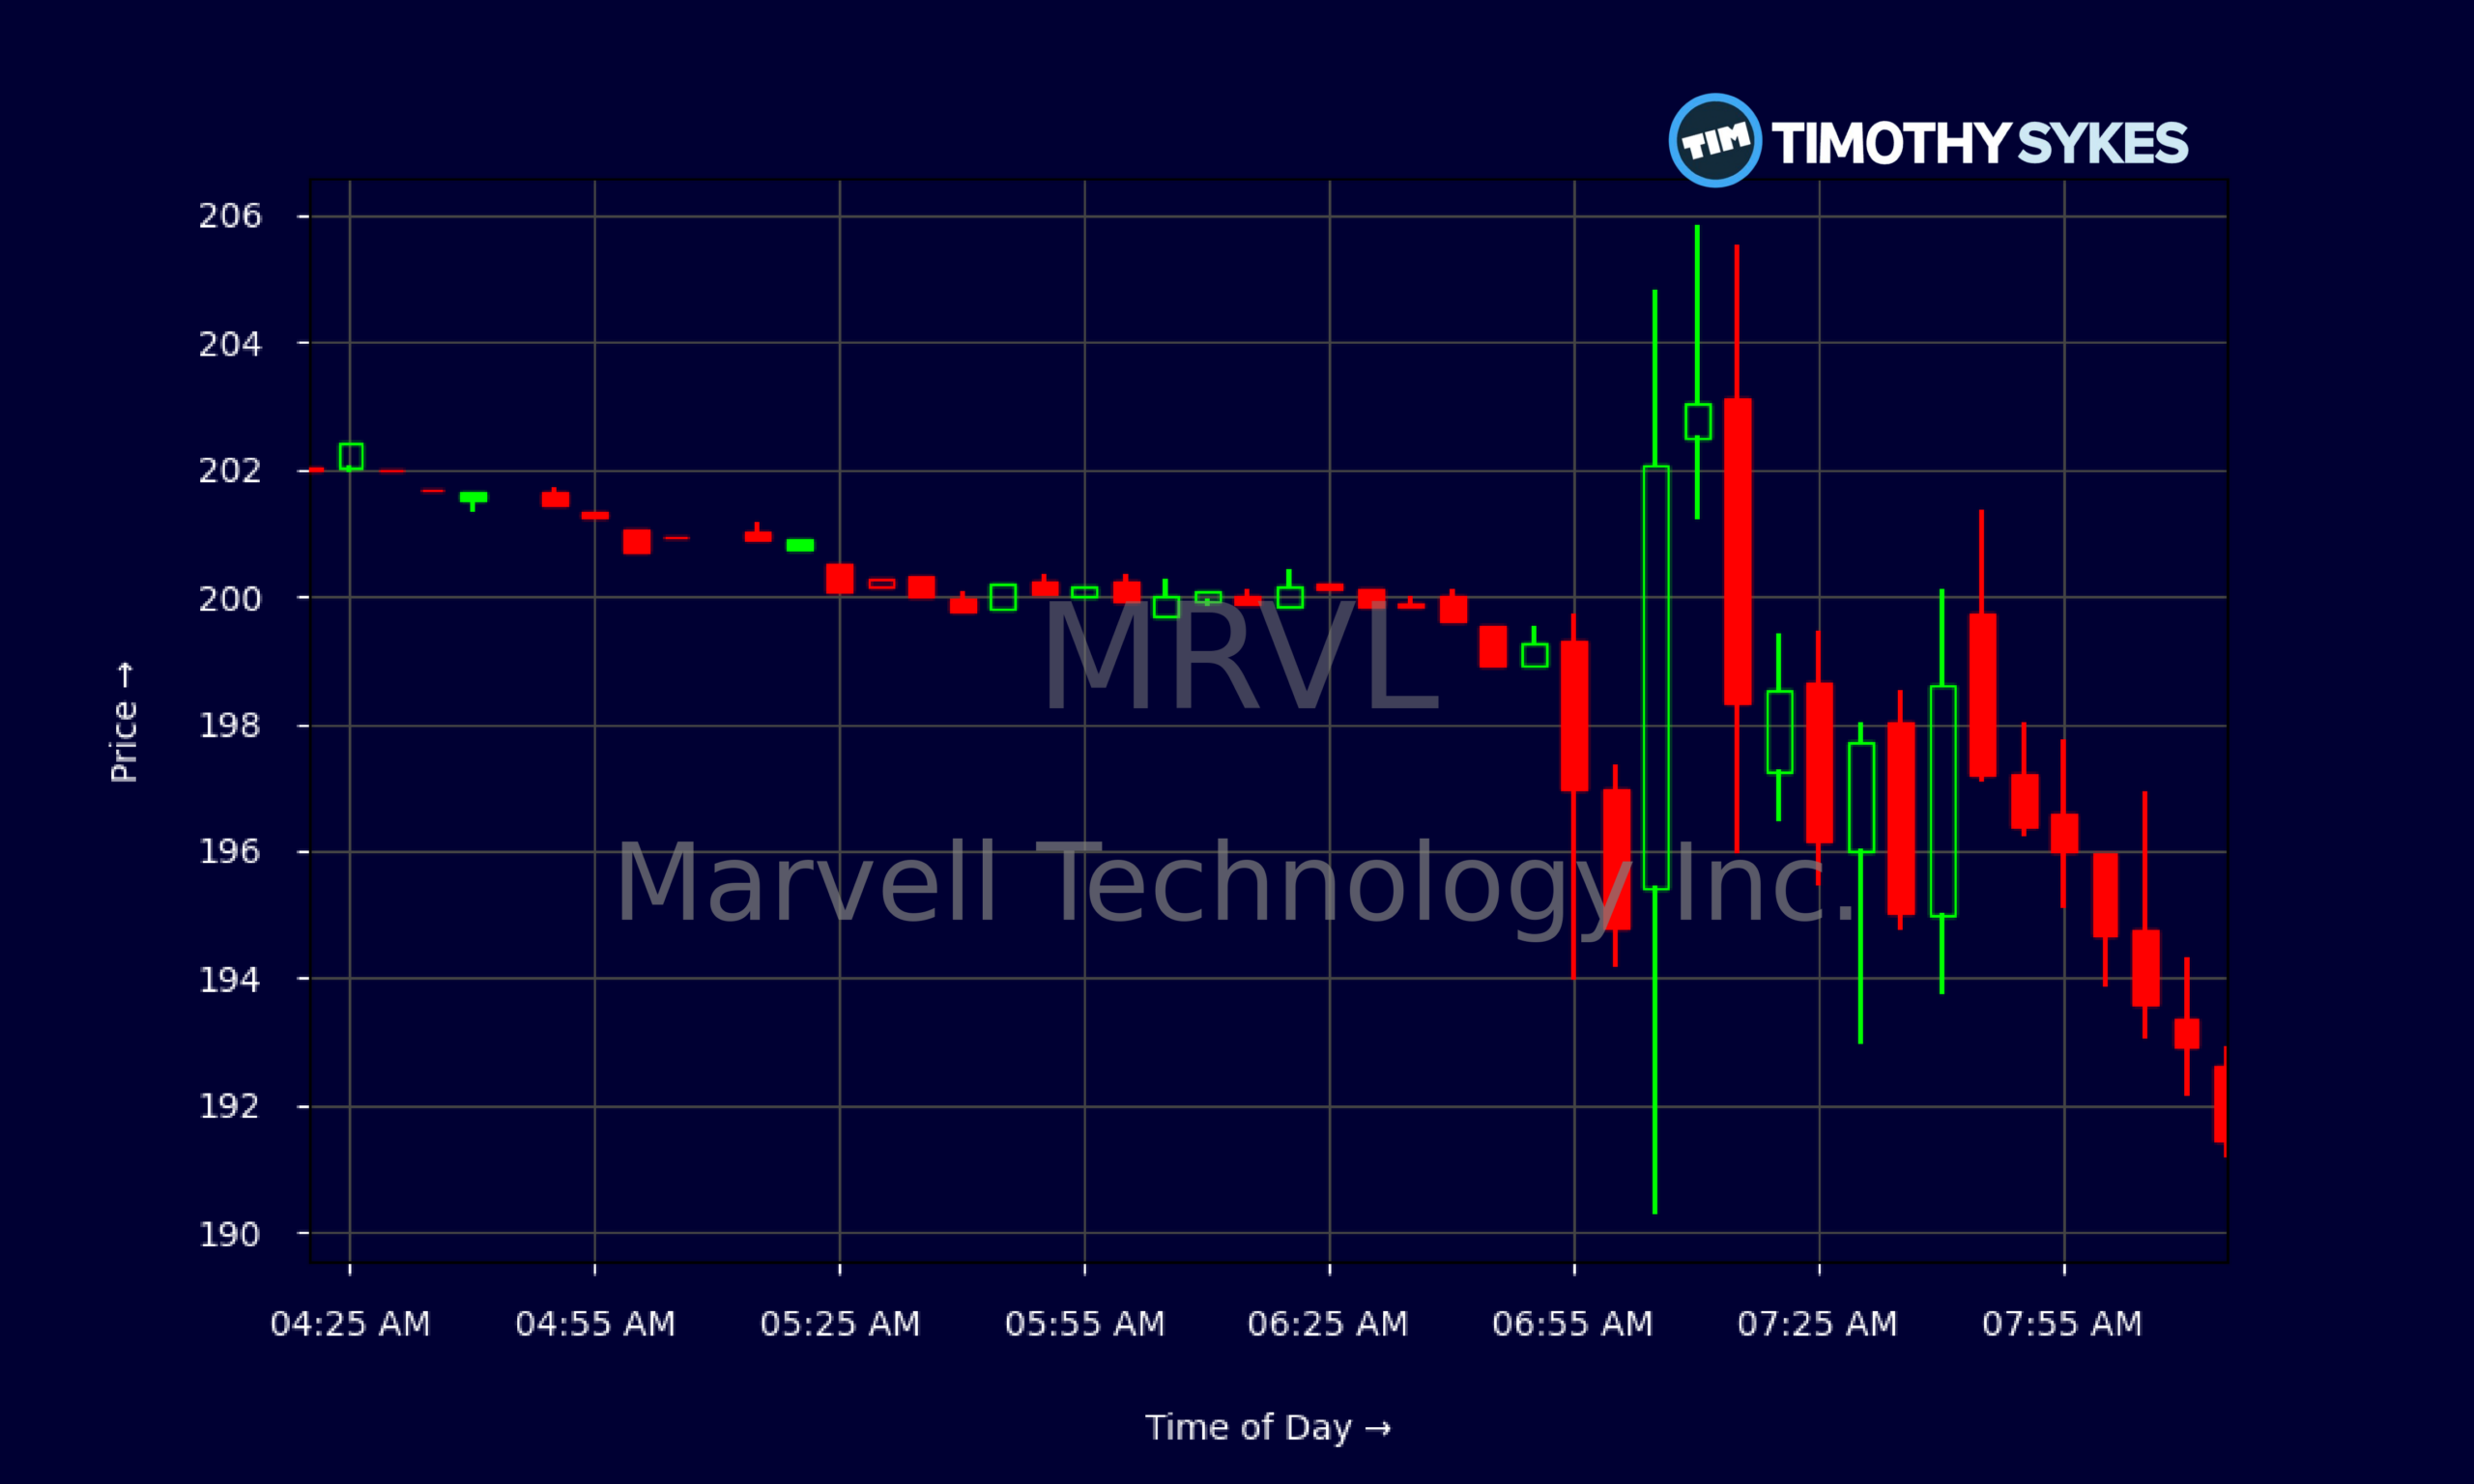
Live Update At 08:18:56 EST: On Monday, November 02, 2026 Marvell Technology Inc. stock [NASDAQ: MRVL] is trending down by -2.59%! Discover the key drivers behind this movement as well as our expert analysis in the detailed breakdown below.
Quick Financial Overview
MRVL is trading like a textbook high-growth chip name: big profits, bigger expectations, and wild swings. On the top line, Marvell Technology Inc. generated about $8.19B in revenue, with revenue growing in the high teens over the last several years. That is solid for any semiconductor name, especially one tied to data centers and networking.
Profitability stands out. MRVL shows gross margin around 52%, EBIT margin above 33%, and profit margin near 28%. In plain English, the company keeps a large chunk of every dollar it brings in. That gives Marvell Technology Inc. room to weather cycles and still pour cash into research.
The balance sheet helps the story. MRVL sits on roughly $3.93B in cash and short-term investments, with total liabilities around $9.02B and a current ratio above 3. That suggests near-term bills are covered. Leverage looks manageable, with total debt to equity at 0.27 and healthy interest coverage.
More Breaking News
The risk is valuation. MRVL trades at a P/E above 90 and price-to-cash-flow near 100. Those numbers say traders are paying up for future AI growth and cannot afford a serious slowdown.
Why Traders Are Watching MRVL Price Action
MRVL’s chart tells you more than any headline today. On the multi-day view, Marvell Technology Inc. ran as high as about $283 earlier in the period and then began to roll over. Recent closes near $196 mark a steep retrace of more than 30% from peak levels. That is a real shakeout, not a tiny dip.
Look at the past week in the data: MRVL chopped between roughly $230 and $270 before breaking lower. You can see a series of lower highs — $278, then $269, then $264, then $253, and so on — classic distribution behavior as late buyers get stuck and stronger hands start unloading. The final break to a $190.15 low and $196.40 close shows momentum clearly shifting to the downside.
Intraday, MRVL is trying to stabilize. Pre-market and early prints cluster around $200, with tight five-minute candles between $199 and $201 for long stretches. That type of range often means big money is waiting, not urgently dumping. Later, the tape shows heavier whips from $190 to above $205, signaling short-term traders battling around key levels.
With MRVL’s rich valuation and powerful fundamentals, this is a battleground stock. Breaks below the recent $190 low would confirm further downside pressure, while reclaiming and holding above the $205–$210 zone could start building a new base. Traders watching Marvell Technology Inc. intraday will focus on volume spikes and whether dips get bought aggressively or fade on weak rebounds.
In short, MRVL has moved from straight-up momentum to a true test of conviction on the chart.
Conclusion
For active traders, MRVL is the kind of name that rewards discipline and punishes stubbornness. Marvell Technology Inc. has strong financials: high margins, solid cash flow, and a balance sheet that supports ongoing AI and data-center spending. The latest quarterly data shows operating income near $457M on revenue of about $2.74B, plus free cash flow around $474M. That is real earnings power behind the ticker.
But the market already knows that. With MRVL trading at over 90 times earnings and more than 25 times sales, the bar is sky high. When expectations stretch this far, price action becomes the primary signal. The recent slide from the $270–$280 area down into the $190s is the market reminding everyone that momentum cuts both ways.
Right now, MRVL sits in a zone where breakouts and breakdowns can happen fast. Short-term traders are watching the $190 support and $205–$210 resistance, using those levels to frame risk. The key is to treat Marvell Technology Inc. like any volatile tech leader: respect the trend, size small, and react, don’t hope. As millionaire penny stock trader and teacher Tim Sykes, says, “Small gains add up over time; focus on building wealth gradually, not chasing jackpots.” In a name this volatile, that kind of steady, process-driven approach can keep traders grounded when the chart starts to move.
Or as Tim Sykes likes to say, “The market doesn’t care about your opinion, only your discipline.” For traders studying MRVL, that mindset is the real edge.
This is stock news, not investment advice. Timothy Sykes News delivers real-time stock market news focused on key catalysts driving short-term price movements. Our content is tailored for active traders and investors seeking to capitalize on rapid price fluctuations, particularly in volatile sectors like penny stocks. Readers come to us for detailed coverage on earnings reports, mergers, FDA approvals, new contracts, and unusual trading volumes that can trigger significant short-term price action. Some users utilize our news to explain sudden stock movements, while others rely on it for diligent research into potential investment opportunities.
Dive deeper into the world of trading with Timothy Sykes, renowned for his expertise in penny stocks. Explore his top picks and discover the strategies that have propelled him to success with these articles:
- Penny Stocks Trading Guide
- Best Penny Stocks Under $1 to Buy Today
- Top 8 Penny Stocks to Watch on Robinhood
Once you’ve got some stocks on watch, elevate your trading game with StocksToTrade the ultimate platform for traders. With specialized tools for swing and day trading, StocksToTrade will guide you through the market’s twists and turns.
Dig into StocksToTrade’s watchlists here:





Leave a reply