

Keel Infrastructure Corp. stocks have been trading down by -8.74 percent after disappointing quarterly earnings and reduced forward guidance.
Key Takeaways For KEEL Traders
- Shares of KEEL have fallen from above $3.00 to under $1.90, signaling sustained selling pressure and fading momentum.
- The latest quarter shows Keel Infrastructure Corp. generating about $30M in revenue but posting a net loss near $65M.
- KEEL holds roughly $716M in cash against about $1.03B in long-term debt, giving the company runway but with heavy leverage risk.
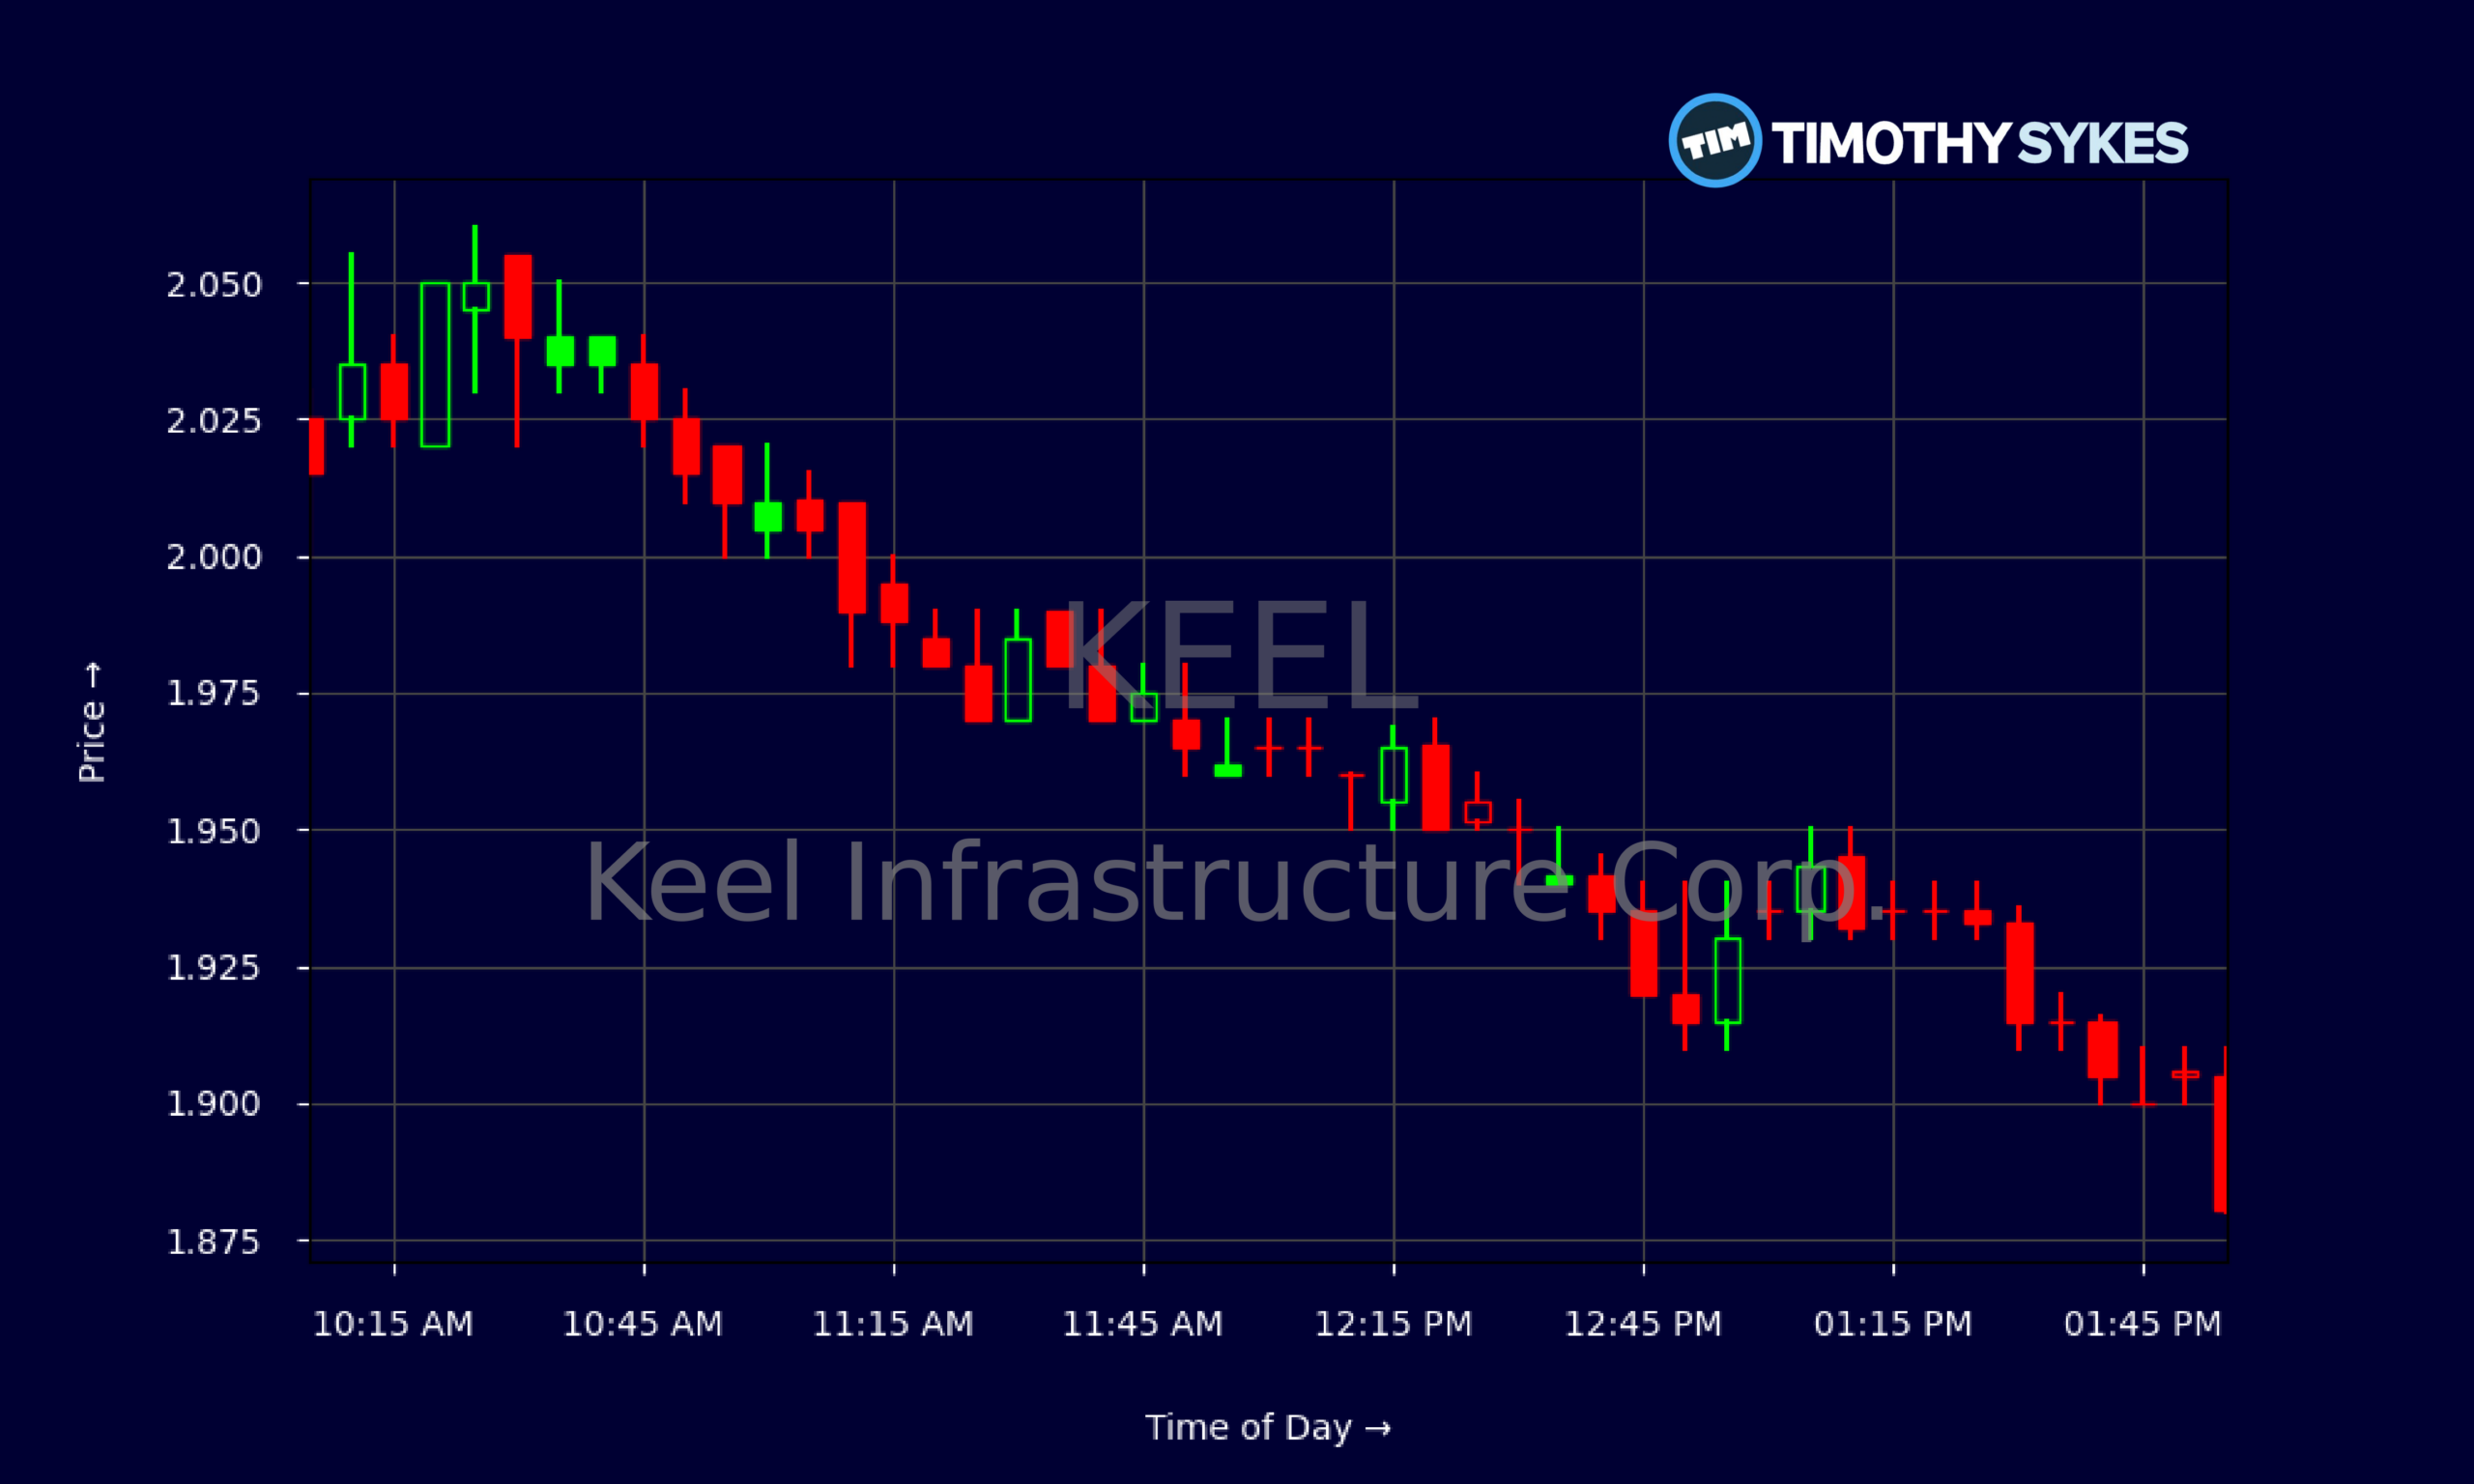
- Intraday trading in KEEL shows a steady grind lower, with failed attempts to hold the $2.00 level turning into an afternoon fade.
- Active traders are tracking support near $1.85 and prior resistance areas above $2.30 as potential short-term trading levels.
Live Update At 14:02:03 EST: On Monday, November 02, 2026 Keel Infrastructure Corp. stock [NASDAQ: KEEL] is trending down by -8.74%! Discover the key drivers behind this movement as well as our expert analysis in the detailed breakdown below.
Quick Financial Overview
KEEL is trading like a broken momentum chart. Over the last several weeks, Keel Infrastructure Corp. slid from the low $3.00s down toward the high $1.80s. That is a sharp pullback, and traders who chased late are feeling it. The daily candles show a clear series of lower highs and lower lows, which tells you supply is still in control.
On the fundamental side, KEEL reported about $30.4M in total revenue for the latest quarter but logged a net loss of roughly $65M. That kind of negative spread explains why profit margins are deeply red, with EBIT and net margins heavily negative. KEEL is growing revenue year over year, but it is burning plenty of cash in the process.
More Breaking News
The balance sheet of Keel Infrastructure Corp. is a mixed bag. KEEL has a big cash pile of around $716M and working capital north of $840M, which buys time. But long‑term debt of about $1.02B and return on equity deeply negative show that capital is not yet earning its keep. For traders, that combo often means volatility around any shift in sentiment.
Why Traders Are Watching KEEL Price Action
Right now, KEEL is a classic teaching chart for momentum traders. Keel Infrastructure Corp. ripped earlier in the month into the $3.20–$3.30 zone, then started to roll over. From there, KEEL printed a stair‑step drop: first failing to hold $3.00, then $2.80, then $2.50, and now the stock is struggling below $2.00. When you see that kind of trend, the message is simple — bounces are getting sold.
Intraday, KEEL opened around $2.09 and tried to push above $2.02–$2.05 early, but the tape never showed real strength. By midday, Keel Infrastructure Corp. was grinding around $1.95–$2.00 with tight, choppy candles, a sign of indecision. In the afternoon, that indecision broke to the downside, and KEEL faded to roughly $1.88 into the close. That’s classic “morning pop, afternoon drop” action.
For short‑term traders, those intraday levels matter. The $2.00 area has turned from prior support into near‑term resistance. If KEEL reclaims and holds above $2.00 with volume, you could see a quick push toward recent daily levels around $2.20–$2.30. If it stays capped, the next spot many day traders will watch is the low $1.80s as potential support.
At the same time, the fundamentals of Keel Infrastructure Corp. explain why bigger money is cautious. Huge negative margins, heavy leverage, and negative returns on capital keep longer‑term buyers tentative. That tension between big losses and a big cash cushion is exactly why KEEL can swing hard in both directions when sentiment shifts.
Conclusion
KEEL sits at an important spot on the chart. Keel Infrastructure Corp. has bled off a big chunk of its prior move, and the trend is still down, but the stock now trades near a key psychological level around $1.85–$2.00. For aggressive traders, this is where discipline matters most. Chasing random bounces in KEEL without a plan is how accounts blow up.
On the plus side, KEEL’s cash position is strong, and its high current ratio signals near‑term liquidity is not the problem. The problem is that Keel Infrastructure Corp. is losing money fast, with ugly margins and negative returns across the board. Until the numbers improve or the market spots a credible path to better economics, every spike in KEEL is at risk of turning into another fade.
For active traders, the playbook is simple but not easy. Study how KEEL behaves around prior support and resistance, track volume on every push, and be ready to walk away fast if the pattern breaks. As Tim Sykes likes to say, “Cut losses quickly, don’t invest in hope, and always let the chart confirm the story.” As millionaire penny stock trader and teacher Tim Sykes, says, “Be patient, don’t force trades, and let the perfect setups come to you.”. KEEL gives traders a live case study of exactly what that means in real time.
This is stock news, not investment advice. Timothy Sykes News delivers real-time stock market news focused on key catalysts driving short-term price movements. Our content is tailored for active traders and investors seeking to capitalize on rapid price fluctuations, particularly in volatile sectors like penny stocks. Readers come to us for detailed coverage on earnings reports, mergers, FDA approvals, new contracts, and unusual trading volumes that can trigger significant short-term price action. Some users utilize our news to explain sudden stock movements, while others rely on it for diligent research into potential investment opportunities.
Dive deeper into the world of trading with Timothy Sykes, renowned for his expertise in penny stocks. Explore his top picks and discover the strategies that have propelled him to success with these articles:
- Penny Stocks Trading Guide
- Best Penny Stocks Under $1 to Buy Today
- Top 8 Penny Stocks to Watch on Robinhood
Once you’ve got some stocks on watch, elevate your trading game with StocksToTrade the ultimate platform for traders. With specialized tools for swing and day trading, StocksToTrade will guide you through the market’s twists and turns.
Dig into StocksToTrade’s watchlists here:




Leave a reply