

Leverage Shares 2X Long SPCX Daily ETF fell as stocks have been trading down by -10.46 percent amid bearish sentiment
Key Takeaways
- SPCH has slid from recent highs above $12 to the mid-$8s, showing a sharp volatility cycle typical of leveraged products.
- Recent daily candles on SPCH reflect heavy selling, but the latest sessions hint at stabilizing prices and tighter trading ranges.
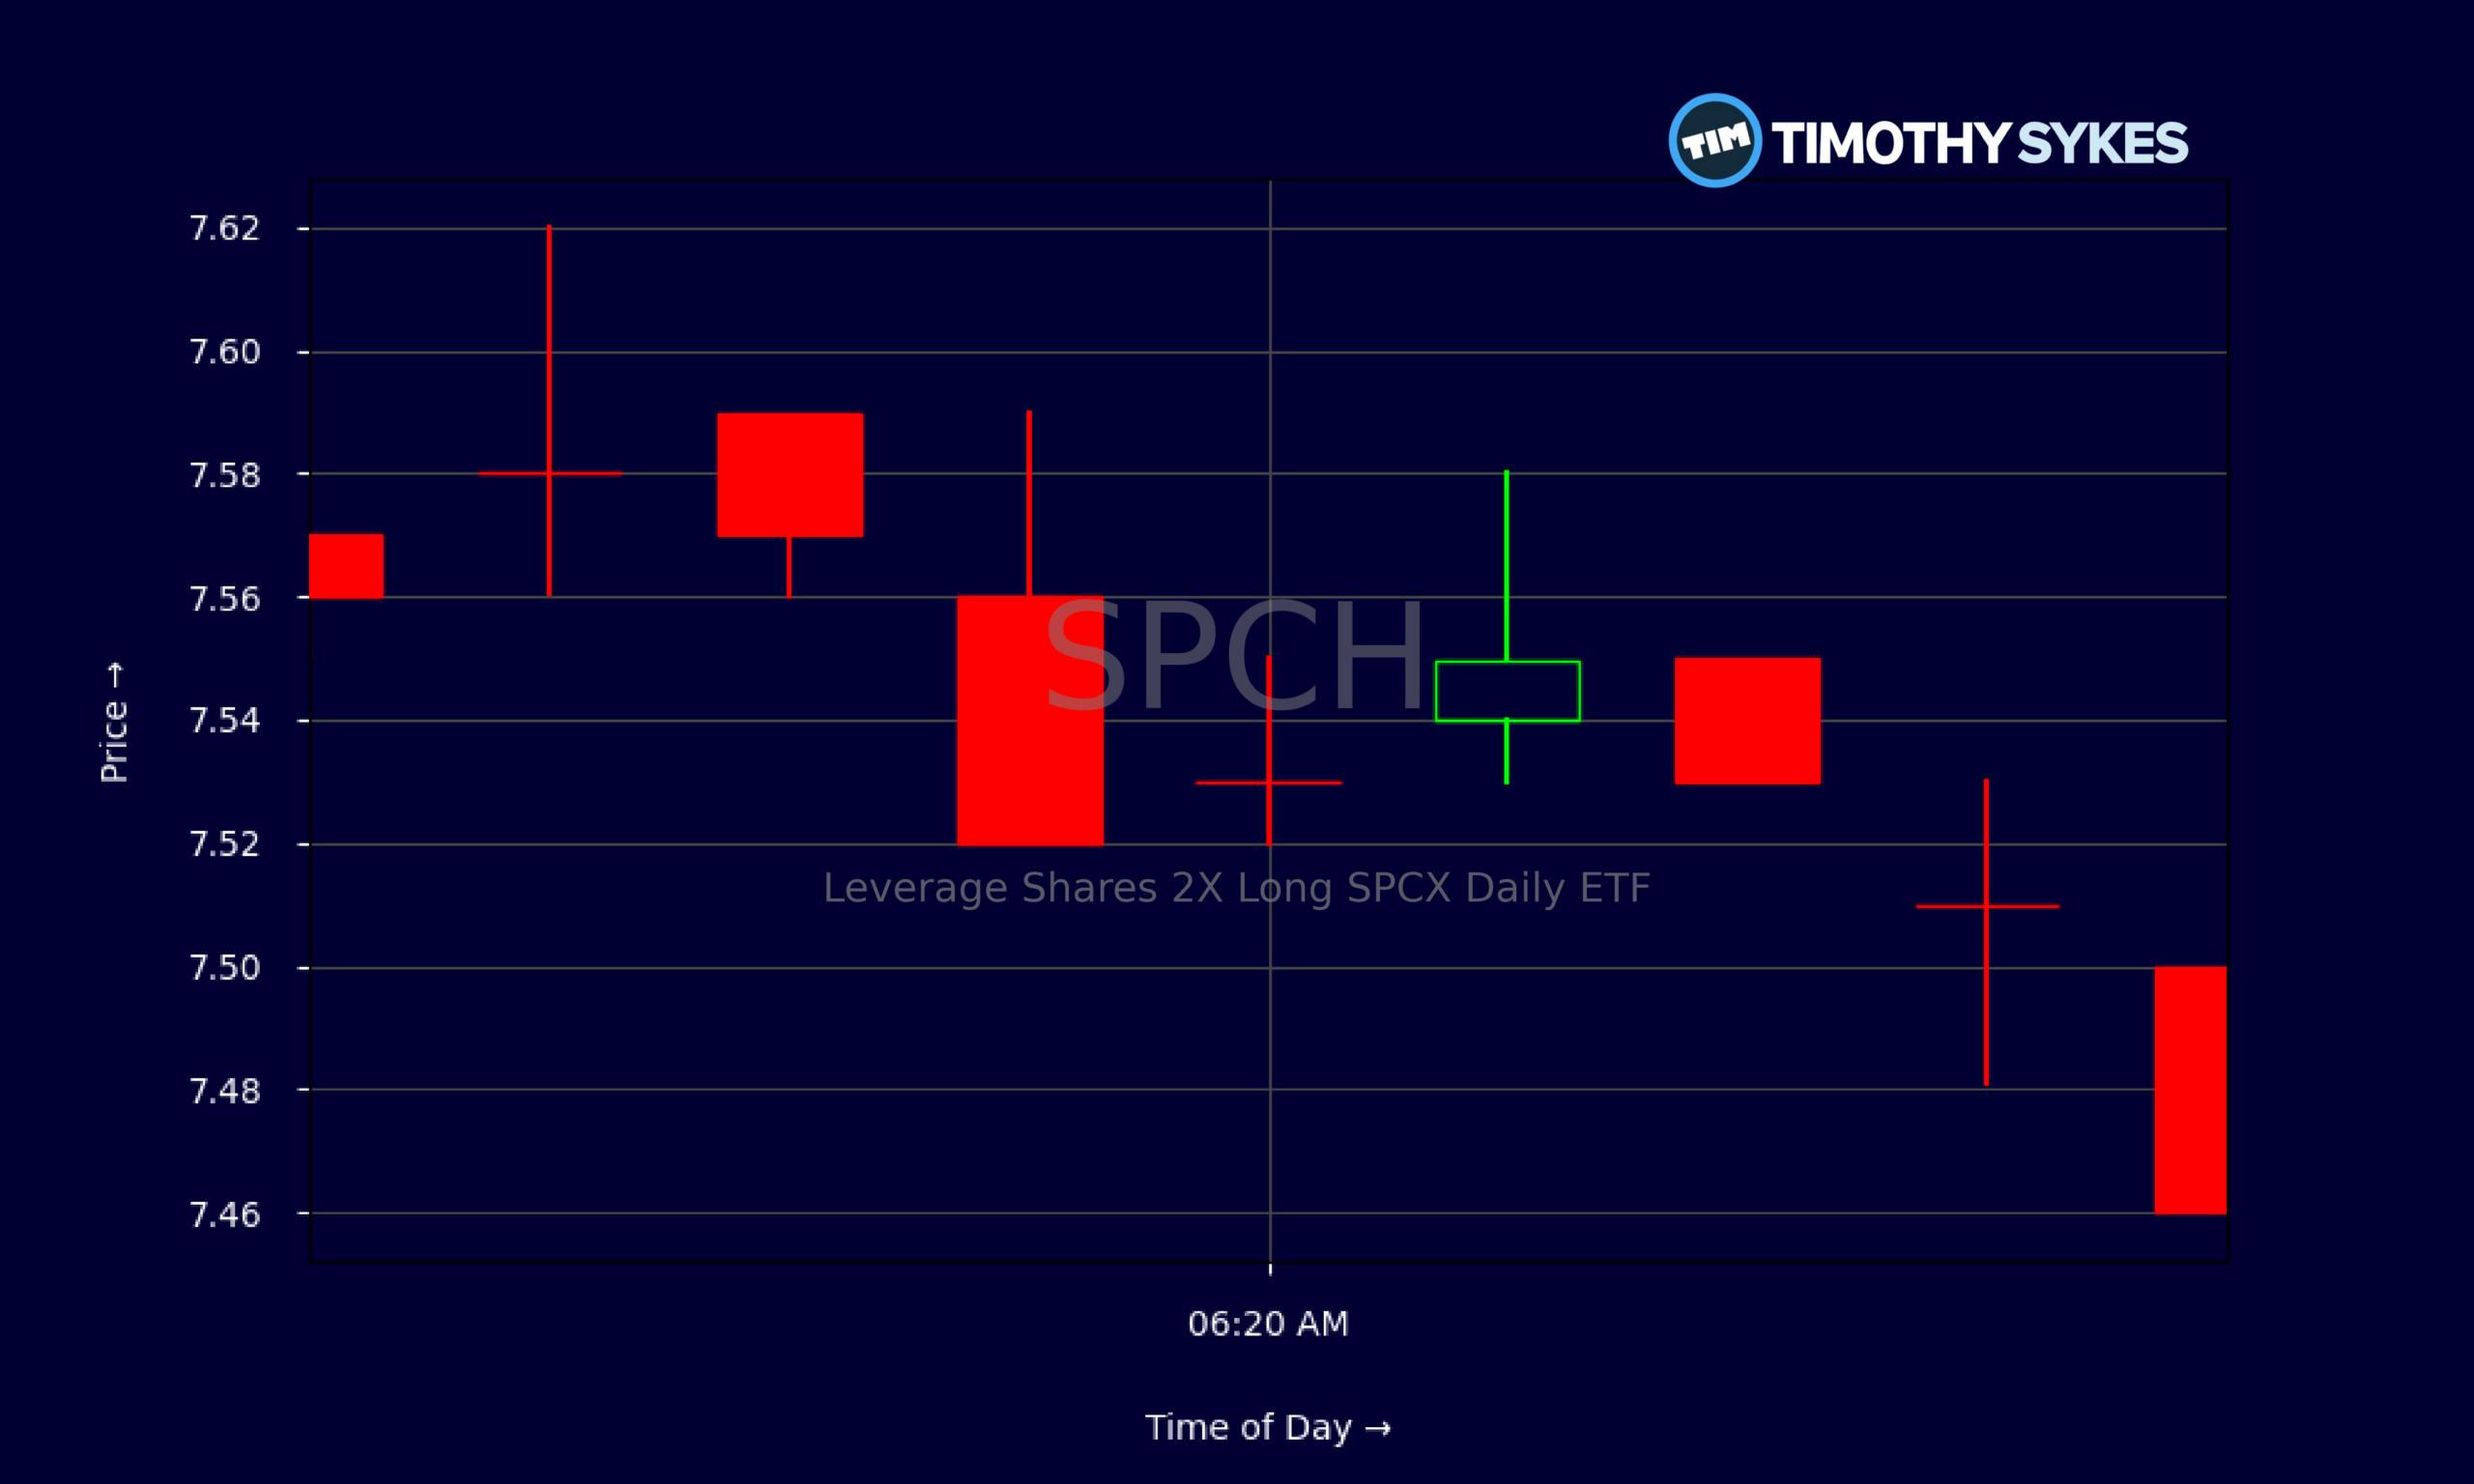
- Intraday SPCH action around $7.50 shows quiet consolidation, suggesting traders are waiting for the next strong directional move.
- With no clear fundamental ratios posted, SPCH trading is being driven mainly by chart levels and sentiment in the small‑cap SPAC space.
Live Update At 06:48:33 EST: On Wednesday, November 04, 2026 Leverage Shares 2X Long SPCX Daily ETF stock [BATS Global Markets: SPCH] is trending down by -10.46%! Discover the key drivers behind this movement as well as our expert analysis in the detailed breakdown below.
Quick Financial Overview
Leverage Shares 2X Long SPCX Daily ETF, trading under the ticker SPCH, is a leveraged product designed to amplify moves in a basket of SPAC‑related names. That leverage matters. It explains why SPCH can move far faster than the underlying holdings and why traders need to respect risk.
On the daily chart, SPCH has retreated from closes above $12 earlier in the month down to roughly the mid‑$8s. That’s a steep pullback in a short window, signaling aggressive profit‑taking and possible forced de‑risking among short‑term traders. Each dollar move in SPCH represents outsized percentage swings, which is exactly what momentum traders seek — but it cuts both ways.
More Breaking News
There are no meaningful profitability or balance‑sheet ratios listed for SPCH, which is normal for an ETF built on derivatives exposure rather than a standard operating business. For traders, that shifts the focus toward price action, volatility, and liquidity rather than classic fundamentals. SPCH essentially becomes a technical trading vehicle tied to sentiment in the SPAC complex. When that sentiment heats up, SPCH usually responds quickly. When it cools, the downside can be just as fast.
Why Traders Are Watching SPCH Price Action
The daily chart for SPCH tells a clear story. Earlier in the period, SPCH pushed as high as the low‑$12s before momentum stalled. From there, the ETF rolled over in stages: first slipping through $11, then losing the $10 area, and finally testing the $8s. Each leg down came with wide intraday ranges, which shows active trading and emotion in the tape.
For traders who live on volatility, this is the kind of chart that deserves a spot on the watchlist. SPCH is a leveraged 2X product, which means every trend in the underlying SPAC exposure gets magnified. When the SPAC sector catches a bid, SPCH often accelerates higher. When money rotates out of speculative small caps, SPCH usually takes the hit first and hardest.
Zooming into the intraday 5‑minute data, SPCH has been hovering around $7.45–$7.60 with tight bars and little follow‑through. That’s a big contrast to the earlier, wide daily swings. Tight intraday ranges often signal a “rest” phase. Traders are positioning, but no side has seized control yet.
This kind of consolidation after a hard drop is a tension zone. Active traders in SPCH are watching to see whether the ETF can hold above recent lows and build a base, or whether another wave of selling pushes it into a fresh breakdown. Either way, the chart is setting up for a potentially strong next move.
Conclusion
SPCH, the Leverage Shares 2X Long SPCX Daily ETF, is acting exactly like a leveraged trading tool should. The ETF enjoyed a strong run to the low‑$12s, then gave back a big chunk of those gains as the small‑cap and SPAC landscape cooled. Now, with SPCH sitting in the mid‑$8s on the daily chart and consolidating around $7.50 intraday, traders have a clear technical battleground to track.
Because SPCH lacks traditional earnings, revenue, or debt metrics, the edge here comes from respecting the chart, watching liquidity, and understanding the leveraged structure. SPCH rewards discipline and punishes stubbornness. Fast swings in both directions are baked into the design. As millionaire penny stock trader and teacher Tim Sykes, says, “It’s not about how much money you make; it’s about how much money you keep.” That mindset is especially relevant when dealing with a volatile, leveraged product like SPCH, where risk management and locking in gains are just as important as catching the initial move.
For active traders, the key is to treat SPCH as a short‑term momentum vehicle tied to sentiment in the SPAC ecosystem. That means planning trade levels in advance — where to enter, where to exit, and exactly where to cut a loss if the move fails. As Tim Sykes likes to remind his community, “The market rewards preparation, not hope.” SPCH is a prime example of that lesson in real time, making it a useful educational case study for anyone learning to trade volatile ETFs.
This is stock news, not investment advice. Timothy Sykes News delivers real-time stock market news focused on key catalysts driving short-term price movements. Our content is tailored for active traders and investors seeking to capitalize on rapid price fluctuations, particularly in volatile sectors like penny stocks. Readers come to us for detailed coverage on earnings reports, mergers, FDA approvals, new contracts, and unusual trading volumes that can trigger significant short-term price action. Some users utilize our news to explain sudden stock movements, while others rely on it for diligent research into potential investment opportunities.
Dive deeper into the world of trading with Timothy Sykes, renowned for his expertise in penny stocks. Explore his top picks and discover the strategies that have propelled him to success with these articles:
- Penny Stocks Trading Guide
- Best Penny Stocks Under $1 to Buy Today
- Top 8 Penny Stocks to Watch on Robinhood
Once you’ve got some stocks on watch, elevate your trading game with StocksToTrade the ultimate platform for traders. With specialized tools for swing and day trading, StocksToTrade will guide you through the market’s twists and turns.
Dig into StocksToTrade’s watchlists here:





Leave a reply