

DarkIris Inc. stocks have been trading up by 56.0 percent after transformative AI breakthrough headlines fueled strong investor optimism.
Key Takeaways
- DKI has ripped from sub-$0.05 to above $2 in weeks, drawing aggressive momentum trading and classic low-float behavior.
- Recent daily candles on DarkIris Inc. show heavy wicks and wide ranges, signaling tug-of-war between longs and shorts.
- The balance sheet for DarkIris Inc. shows roughly $1.8M cash and positive working capital, giving DKI some runway despite deep losses.
- Valuation ratios for DKI look beaten down, with price-to-sales near 0.07 and price-to-book around 0.11.
Live Update At 07:32:38 EST: On Wednesday, November 04, 2026 DarkIris Inc. stock [NASDAQ: DKI] is trending up by 56.0%! Discover the key drivers behind this movement as well as our expert analysis in the detailed breakdown below.
Quick Financial Overview
DarkIris Inc. is trading like a typical beaten-down, story-hunting small cap, but the numbers behind DKI matter for any serious trading plan. Revenue sits around $10.1M, yet the market is only pricing DKI at about 0.07 times sales. That is deep discount territory. When traders see that kind of pricing, they know the market has low expectations baked in.
On the balance sheet, DarkIris Inc. reports about $8.4M in total assets and $6.8M in equity, with only about $1.7M in liabilities. Cash of roughly $1.8M plus working capital over $3M suggests DKI is not staring at the edge of a cliff this quarter. However, the return on capital near -224% screams operational pain.
More Breaking News
For traders, that mix—terrible profitability but a relatively clean balance sheet—often sets up as a speculation playground. DKI is cheap on paper, but not because the business is thriving. That is exactly why DarkIris Inc. will attract short-term momentum trading around technical levels instead of long-term “value” narratives.
Why Traders Are Watching DKI Price Action
The chart on DarkIris Inc. is the real story right now. Just days ago, DKI traded around $0.04–$0.09. Then it exploded to the $2–$2.50 range. That is a massive multi-bagger move in a very short window. Moves like that do not happen in calm, mature names; they show up in thin floats where a surge in volume feeds on itself.
Look at the daily candles for DKI. The jump from roughly $0.14 to $2.00+ is followed by wide-range bars, long wicks, and sharp intraday reversals. DarkIris Inc. went from a $0.18 close to over $2 within a handful of sessions. Those are the kind of momentum waves that reward prepared traders and punish anyone chasing blindly.
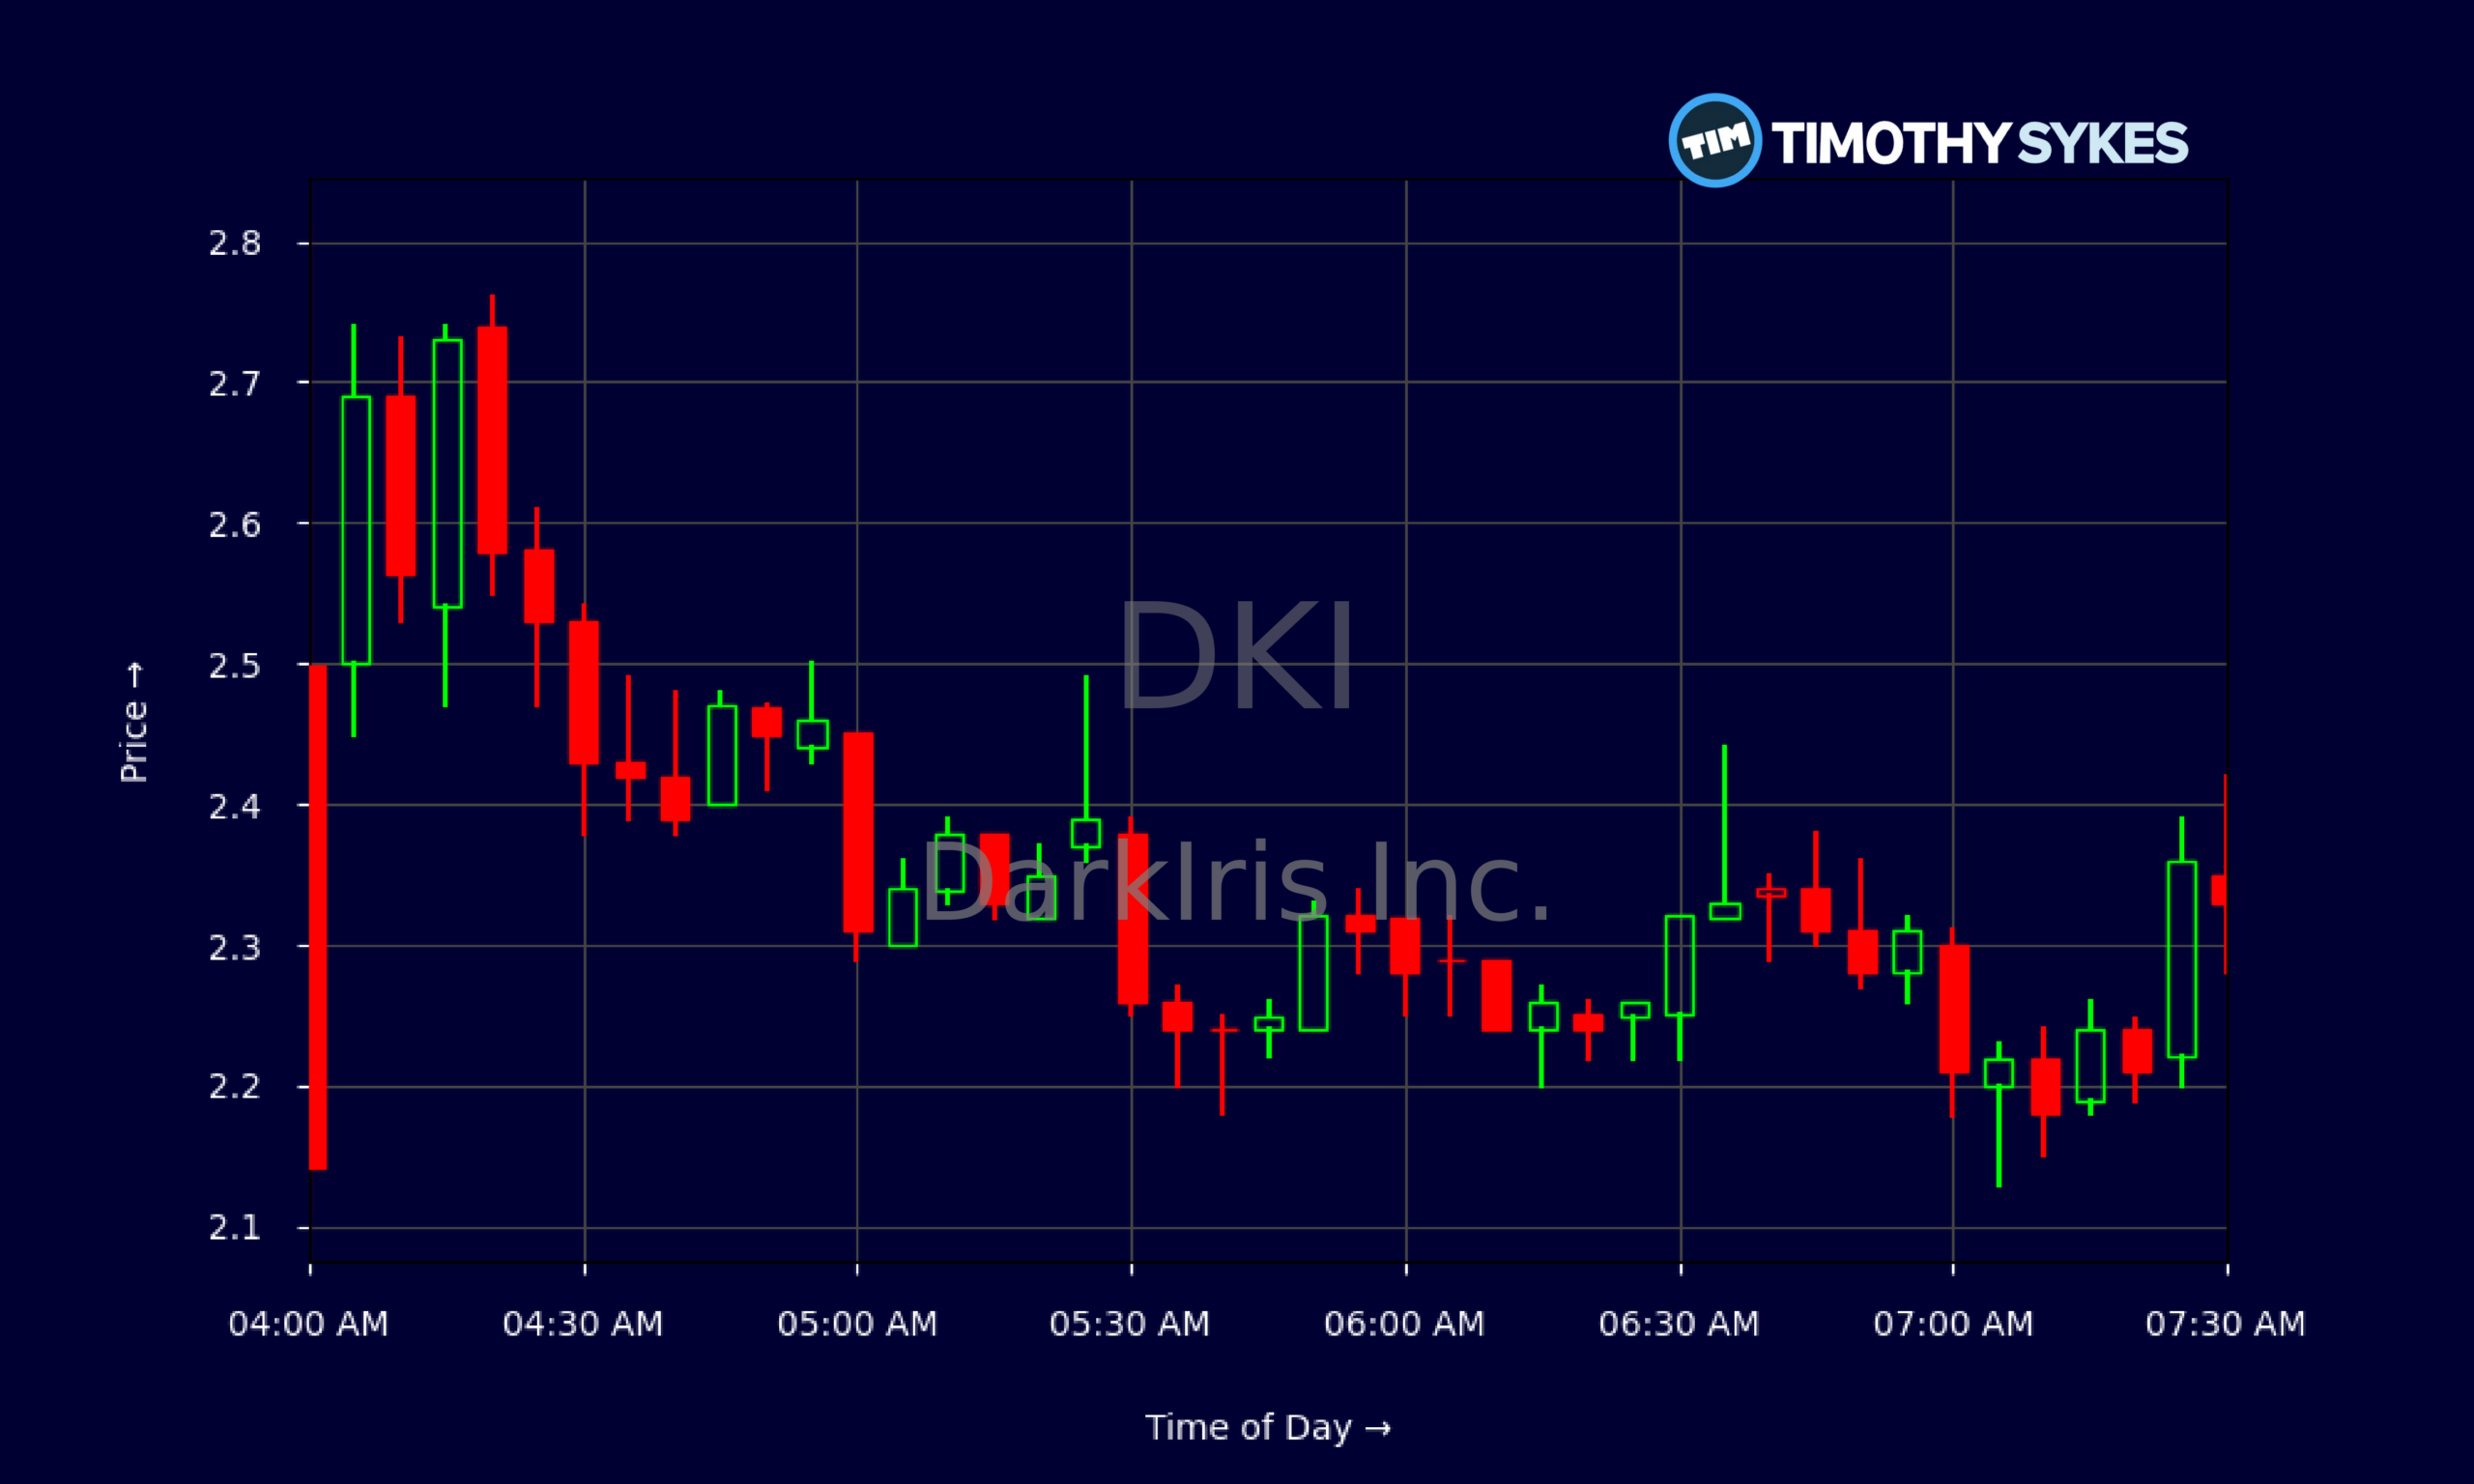
The intraday 5-minute chart confirms it. DKI opened near $2.14, spiked as high as $2.81, then chopped between roughly $2.20 and $2.60. That is a big rollercoaster in one session. DarkIris Inc. shows repeated failed pushes near $2.70–$2.80 and support attempts holding around the low $2.20s. This kind of intraday range attracts scalpers, dip buyers, and short-biased traders all at once.
For day traders, the key with DKI is accepting what the chart is saying: DarkIris Inc. is in a high-volatility phase, driven mostly by technicals. Clean levels, fast tightening of ranges, and volume fading or surging will dictate the next move far more than slow-moving fundamentals in this kind of tape.
Conclusion
DarkIris Inc. sits at the crossroads of ugly fundamentals and explosive price action, which is exactly where active traders like to hunt. DKI is cheap on classic ratios, but that discount comes with deep negative returns on capital. The balance sheet looks decent for now, yet the income statement shows why the market marked DarkIris Inc. down for so long.
At the same time, the recent move from pennies to the $2 area turned DKI into a momentum magnet. Those daily gaps, intraday spikes, and harsh fades create opportunity for disciplined traders who plan entries and exits in advance. DarkIris Inc. is now on many watchlists for morning gappers, afternoon squeeze setups, and possible multi-day breakouts or breakdowns.
The lesson from DKI aligns with what Tim Sykes drills into his students: “Patterns repeat, but you must respect risk every single time.” As millionaire penny stock trader and teacher Tim Sykes says, “There is always another play around the corner; don’t chase just because you feel FOMO.”. DarkIris Inc. is a live example of that mindset. The pattern—low-priced stock, sudden volume, huge spike—is familiar. The risk is real, and the speed is unforgiving.
For traders studying DKI, the focus should be on price levels, volume shifts, and strict risk management. Use DarkIris Inc. as a chart to learn from, not a lottery ticket. This analysis is for educational and research purposes only, but the discipline you build trading names like DKI can carry over to every ticker on your screen.
This is stock news, not investment advice. Timothy Sykes News delivers real-time stock market news focused on key catalysts driving short-term price movements. Our content is tailored for active traders and investors seeking to capitalize on rapid price fluctuations, particularly in volatile sectors like penny stocks. Readers come to us for detailed coverage on earnings reports, mergers, FDA approvals, new contracts, and unusual trading volumes that can trigger significant short-term price action. Some users utilize our news to explain sudden stock movements, while others rely on it for diligent research into potential investment opportunities.
Dive deeper into the world of trading with Timothy Sykes, renowned for his expertise in penny stocks. Explore his top picks and discover the strategies that have propelled him to success with these articles:
- Penny Stocks Trading Guide
- Best Penny Stocks Under $1 to Buy Today
- Top 8 Penny Stocks to Watch on Robinhood
Once you’ve got some stocks on watch, elevate your trading game with StocksToTrade the ultimate platform for traders. With specialized tools for swing and day trading, StocksToTrade will guide you through the market’s twists and turns.
Dig into StocksToTrade’s watchlists here:





Leave a reply