

Amazon.com Inc. stocks have been trading up by 3.47 percent after strong cloud growth headlines boosted investor optimism.
Key Takeaways Traders Need To Know
- Q3 2026 revenue hit $201.9B, up 12% year over year, with a record 13.9% operating margin, powered by 39% AWS growth and heavy AI capex that pushed free cash flow negative.
- AWS net sales jumped to $45.98B from $33.0B, with operating income rising to $17.77B from $11.43B, showing strong cloud scale and margin expansion that traders are watching closely.
- CEO Andy Jassy flagged AWS growth at 39.3% year over year on a $578B backlog and projected growth above 40% in 2027–2028, framing AWS as a future trillion‑dollar‑revenue engine.
- Bedrock and custom silicon (Graviton, Trainium) are growing at explosive rates, with Fortune 500 Bedrock spend up nearly 7x and Amazon silicon saving customers over $2B in Q3 alone.
- UBS and Freedom Broker raised AMZN price targets and reiterated Buy ratings, leaning into a multi‑year AWS acceleration story and improving retail, logistics, and advertising economics.
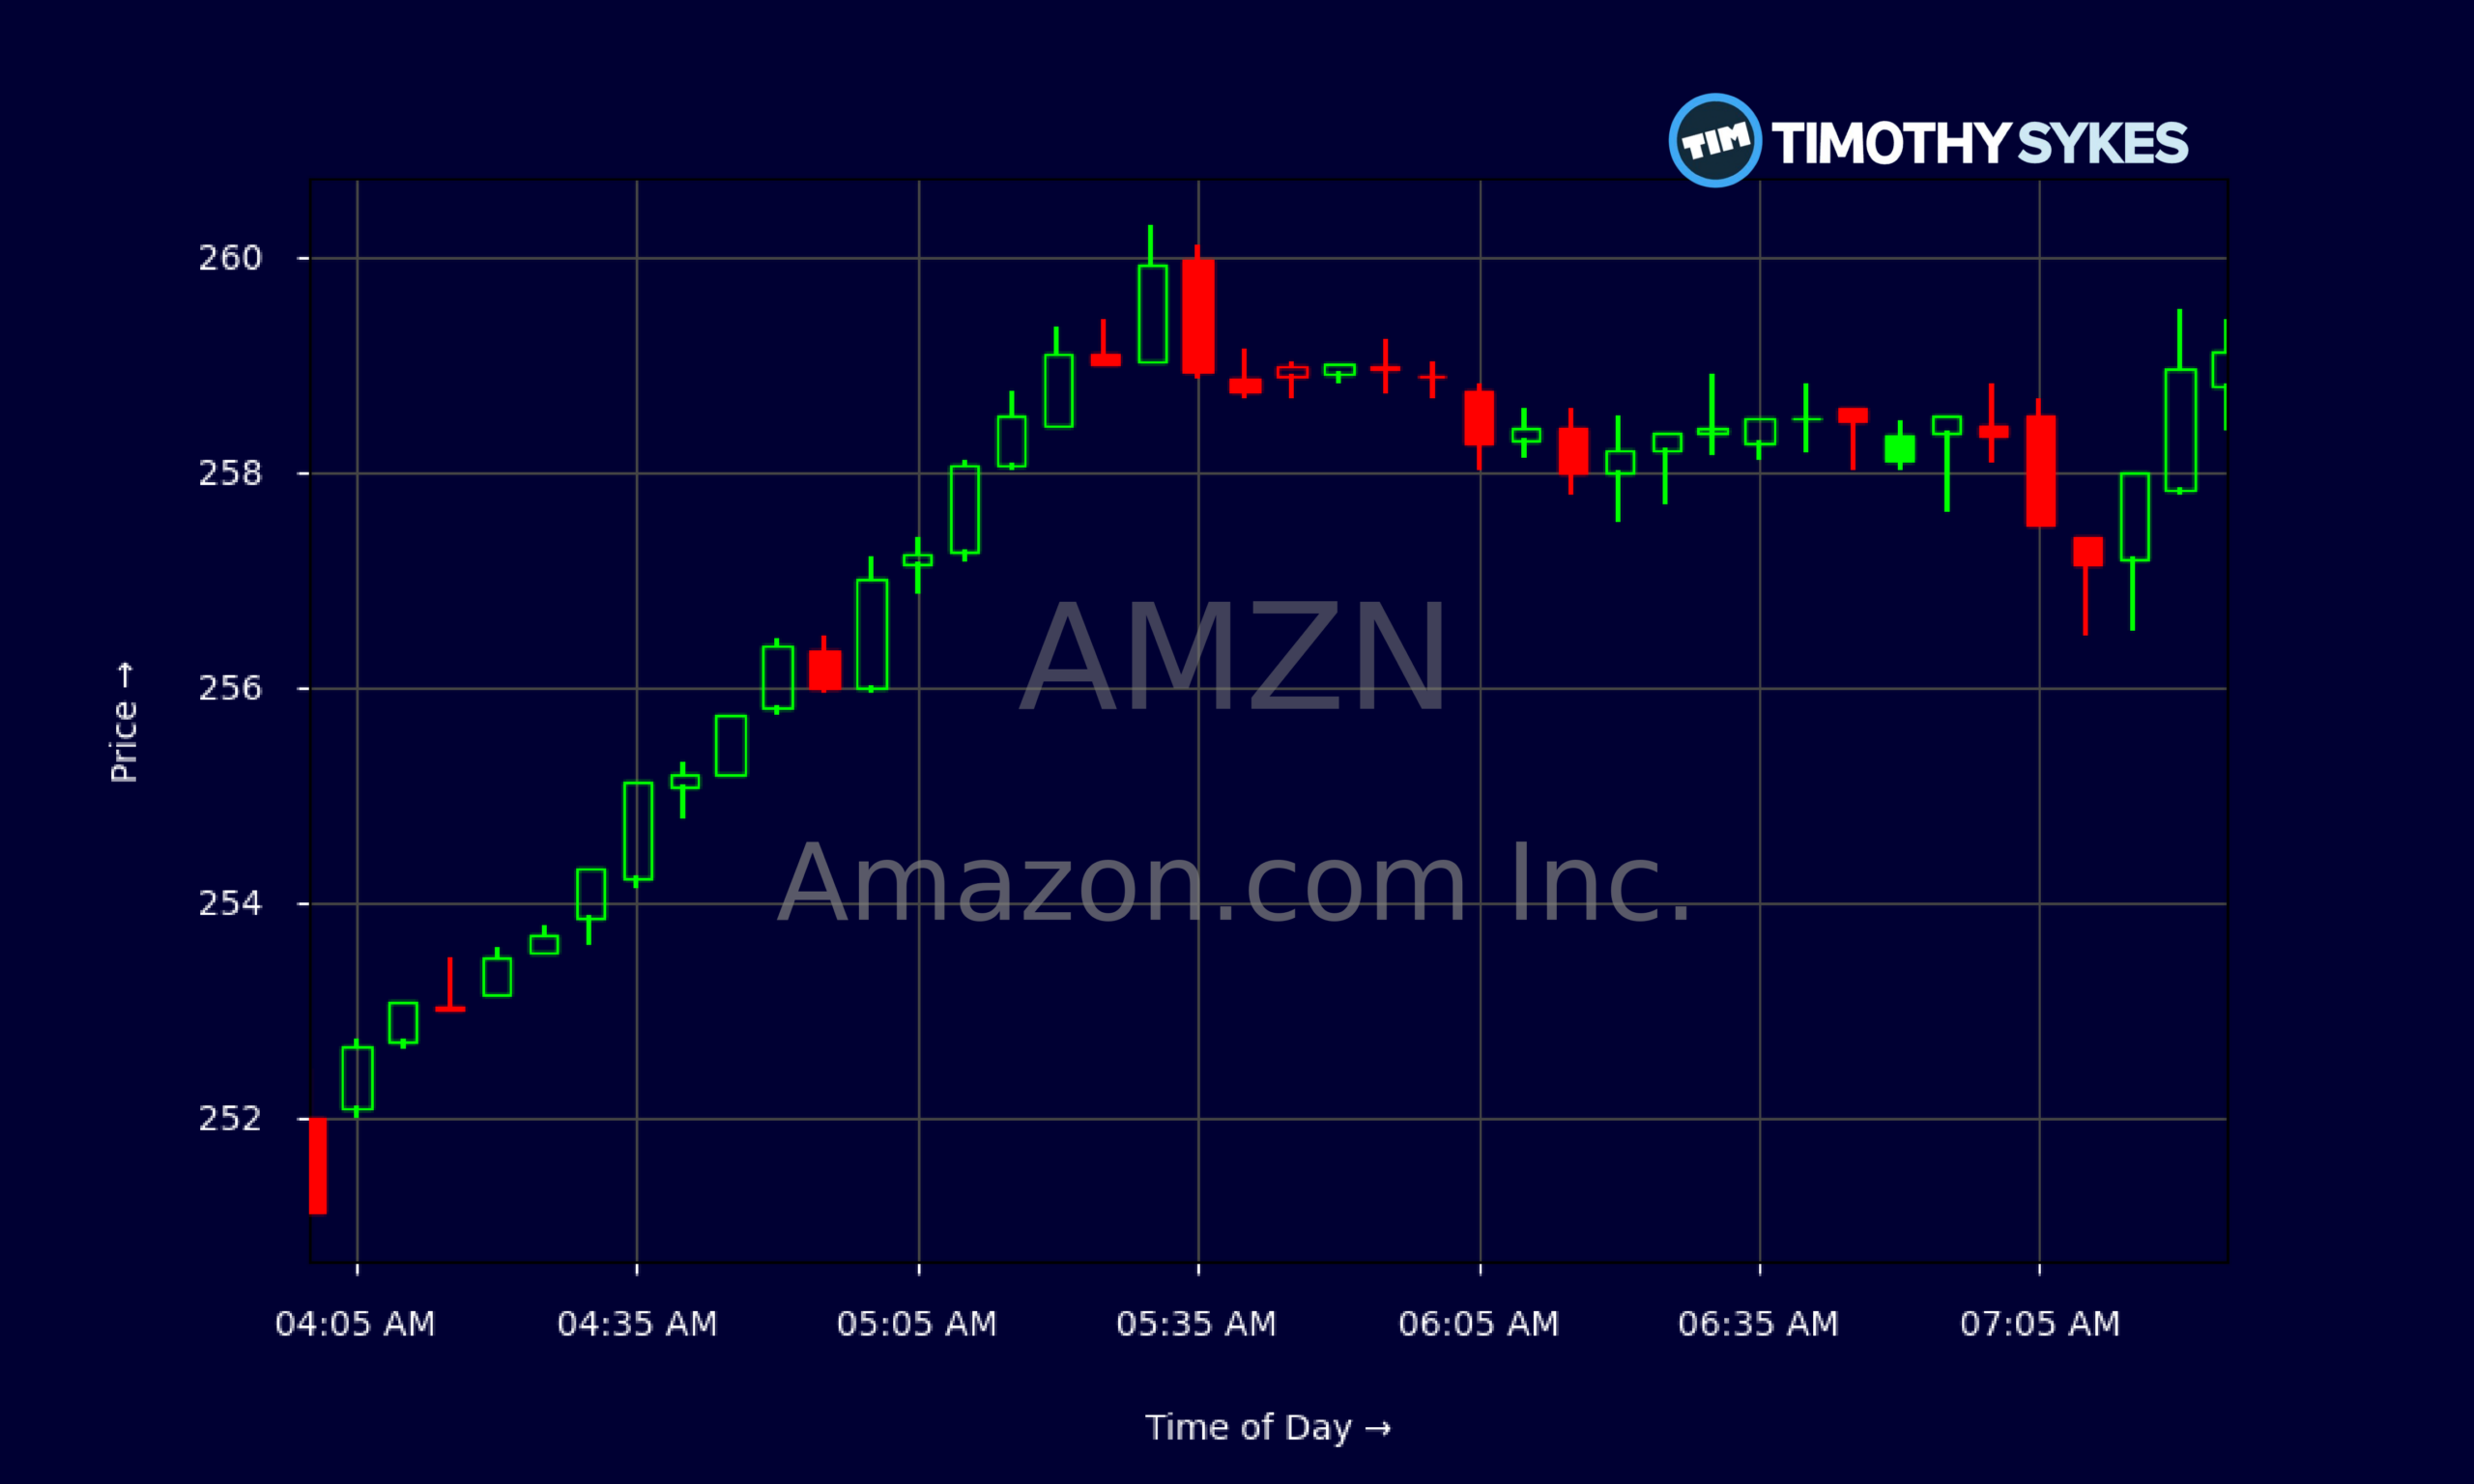
Live Update At 07:33:18 EST: On Wednesday, November 04, 2026 Amazon.com Inc. stock [NASDAQ: AMZN] is trending up by 3.47%! Discover the key drivers behind this movement as well as our expert analysis in the detailed breakdown below.
Quick Financial Overview
AMZN’s chart tells the story of a big tech name grinding higher while traders debate how much good news is already priced in. Over the last few weeks, AMZN has mostly held above $240, with recent closes around $245.63 and $250.69 after a brief dip, signaling dip‑buyers are still active. The stock has been chopping between roughly $230 and the mid‑$260s, forming a wide trading range rather than a blow‑off top.
Intraday, the 5‑minute tape around $255–$260 shows tight ranges and steady bids, not panic. That kind of controlled action often means larger players are accumulating, not dumping. For short‑term traders, AMZN’s liquidity and clean intraday levels around $255 and $260 matter more than the headlines.
More Breaking News
Under the hood, fundamentals back up the bullish tape. AMZN runs at a hefty $716.9B in annual revenue with a 50.8% gross margin and a 23% EBIT margin, strong numbers for a company this big. A price/earnings ratio near 21.1 and price/sales around 3.65 reflect a market that still pays a premium, but not an insane one, for growth plus profitability. Debt looks manageable with total debt‑to‑equity at 0.23 and interest coverage over 76, which gives AMZN plenty of room to keep funding its AWS and AI push without stressing the balance sheet.
Why Traders Are Watching AMZN Right Now
This quarter, AMZN reminded the market what a true mega‑cap growth engine looks like. Q3 2026 sales came in at $201.9B, up 12% year over year, but the real shocker was the 13.9% operating margin — the highest in the company’s history. That margin backdrop matters for trading because it shows AMZN isn’t just chasing revenue; it’s turning scale into real operating leverage.
The core driver is AWS. AMZN reported AWS net sales of $45.98B, up from $33.0B a year ago, while AWS operating income jumped from $11.43B to $17.77B. Jassy said AWS growth has re‑accelerated to 39.3% year over year for the sixth straight quarter, with a massive $578B backlog and a roughly $184B run‑rate business running around a 39% margin. For traders, that backlog is key — it’s forward visibility, a pipeline that supports the bullish analyst targets and makes pullbacks in AMZN interesting to study, not panic over.
Management is leaning hard into the AI cycle. AMZN plans about $220B in 2026 capex, mostly for data centers, servers, and networking for AWS and its Bedrock AI platform. That spending helped push free cash flow to around -$34.8B, which some traders will see as a red flag. But Jassy also noted AWS capacity for 2026 is sold out, 2027 is largely booked, and a big chunk of 2028 is pre‑committed. When capacity is effectively pre‑sold years out, heavy capex becomes more of a calculated bet than a blind gamble.
On top of raw compute, AMZN is building higher‑margin AI layers. Bedrock is now the fastest‑growing multi‑billion‑dollar service in AWS history, with Fortune 500 spending up nearly 7x and token volume up about 17x year over year. Custom chips — Graviton CPUs and Trainium accelerators — are growing triple‑digits, with revenue commitments up more than 20x and over $2B in customer savings in Q3. That vertical stack gives AMZN a moat in AI price‑performance and opens the door to selling Trainium outside AWS by late 2027.
Analysts are responding. UBS lifted its AMZN price target to $352, citing confidence in AWS growth topping 40% in FY27–FY28 and the potential for AWS alone to reach $1T in revenue over time. Freedom Broker bumped its target from $255 to $330, calling this a multi‑year AWS acceleration phase that outweighs Q4 guidance worries and cash burn. When multiple desks lean the same way, traders tend to pay attention.
Meanwhile, the retail machine keeps grinding. A heavily promoted $25 Thanksgiving meal with cut‑rate turkey pricing and broad grocery discounts shows how AMZN uses price to pull consumers deeper into its Prime and same‑day grocery network. The multi‑channel “Open to Fun” campaign with Warner Bros for The Cat in the Hat taps Prime Video, IMDb, Twitch, Alexa, and Brand Stores to drive both ticket sales and high‑margin ad revenue — exactly the kind of ecosystem monetization that can quietly support AMZN’s valuation while headlines focus on AWS.
Conclusion
For active traders, AMZN now trades like a pure‑play AI and cloud leader wrapped inside a global retail and media platform. The Q3 print — 12% revenue growth, $201.9B in sales, and a 13.9% operating margin — reinforced that AWS and AI are steering the story. AWS’s 39% growth, $45.98B in quarterly sales, and $17.77B in operating income give AMZN a cash‑flow engine that can justify the current multiples if management hits its targets.
At the same time, AMZN’s negative free cash flow and $220B capex plan make the stock a battleground on shorter time frames. Bulls focus on the sold‑out AWS capacity for 2026 and heavily booked 2027–2028. Bears point to the cash burn and any quarter‑to‑quarter wobble in cloud demand. That tension is exactly what day traders and swing traders want — volatility backed by real numbers, not just hype.
Retail, grocery, and advertising moves — from the $25 Thanksgiving meal push to the Warner Bros ad partnership — add incremental upside and help AMZN’s non‑cloud businesses keep pace. And with major firms like UBS and Freedom Broker hiking price targets on the back of AWS acceleration and margin expansion, the Street narrative tilts constructive.
The homework for traders is clear: track AWS growth and backlog, monitor how quickly capex turns back into positive free cash flow, and let the chart confirm the story. As Tim Sykes loves to say, “Patterns repeat because human nature doesn’t change — your job is to study them relentlessly and cut losses fast when you’re wrong.” As millionaire penny stock trader and teacher Tim Sykes, says, “There is always another play around the corner; don’t chase just because you feel FOMO.”. AMZN’s current setup gives plenty of data for exactly that kind of disciplined, research‑driven trading — not as advice, but as raw material for those willing to put in the work.
This is stock news, not investment advice. Timothy Sykes News delivers real-time stock market news focused on key catalysts driving short-term price movements. Our content is tailored for active traders and investors seeking to capitalize on rapid price fluctuations, particularly in volatile sectors like penny stocks. Readers come to us for detailed coverage on earnings reports, mergers, FDA approvals, new contracts, and unusual trading volumes that can trigger significant short-term price action. Some users utilize our news to explain sudden stock movements, while others rely on it for diligent research into potential investment opportunities.
Dive deeper into the world of trading with Timothy Sykes, renowned for his expertise in penny stocks. Explore his top picks and discover the strategies that have propelled him to success with these articles:
- Penny Stocks Trading Guide
- Best Penny Stocks Under $1 to Buy Today
- Top 8 Penny Stocks to Watch on Robinhood
Once you’ve got some stocks on watch, elevate your trading game with StocksToTrade the ultimate platform for traders. With specialized tools for swing and day trading, StocksToTrade will guide you through the market’s twists and turns.
Dig into StocksToTrade’s watchlists here:





Leave a reply