

Leverage Shares 2X Long SPCX Daily ETF slid as underlying SPAC sentiment weakened, with stocks have been trading down by -5.57 percent
Key Takeaways
- Leverage Shares 2X Long SPCX Daily ETF (SPCH) has dropped sharply from mid-month highs near $13 to below $9, signaling a heavy momentum unwind.
- Recent SPCH intraday trading shows tight consolidation around $8.80, as volatility cools and day traders battle around the same price zone.
- The leveraged nature of SPCH magnifies moves in underlying SPAC-focused holdings, turning small benchmark swings into outsized ETF swings.
- With fundamental ratios unavailable, SPCH trading remains a pure technical and sentiment-driven vehicle for short-term traders.
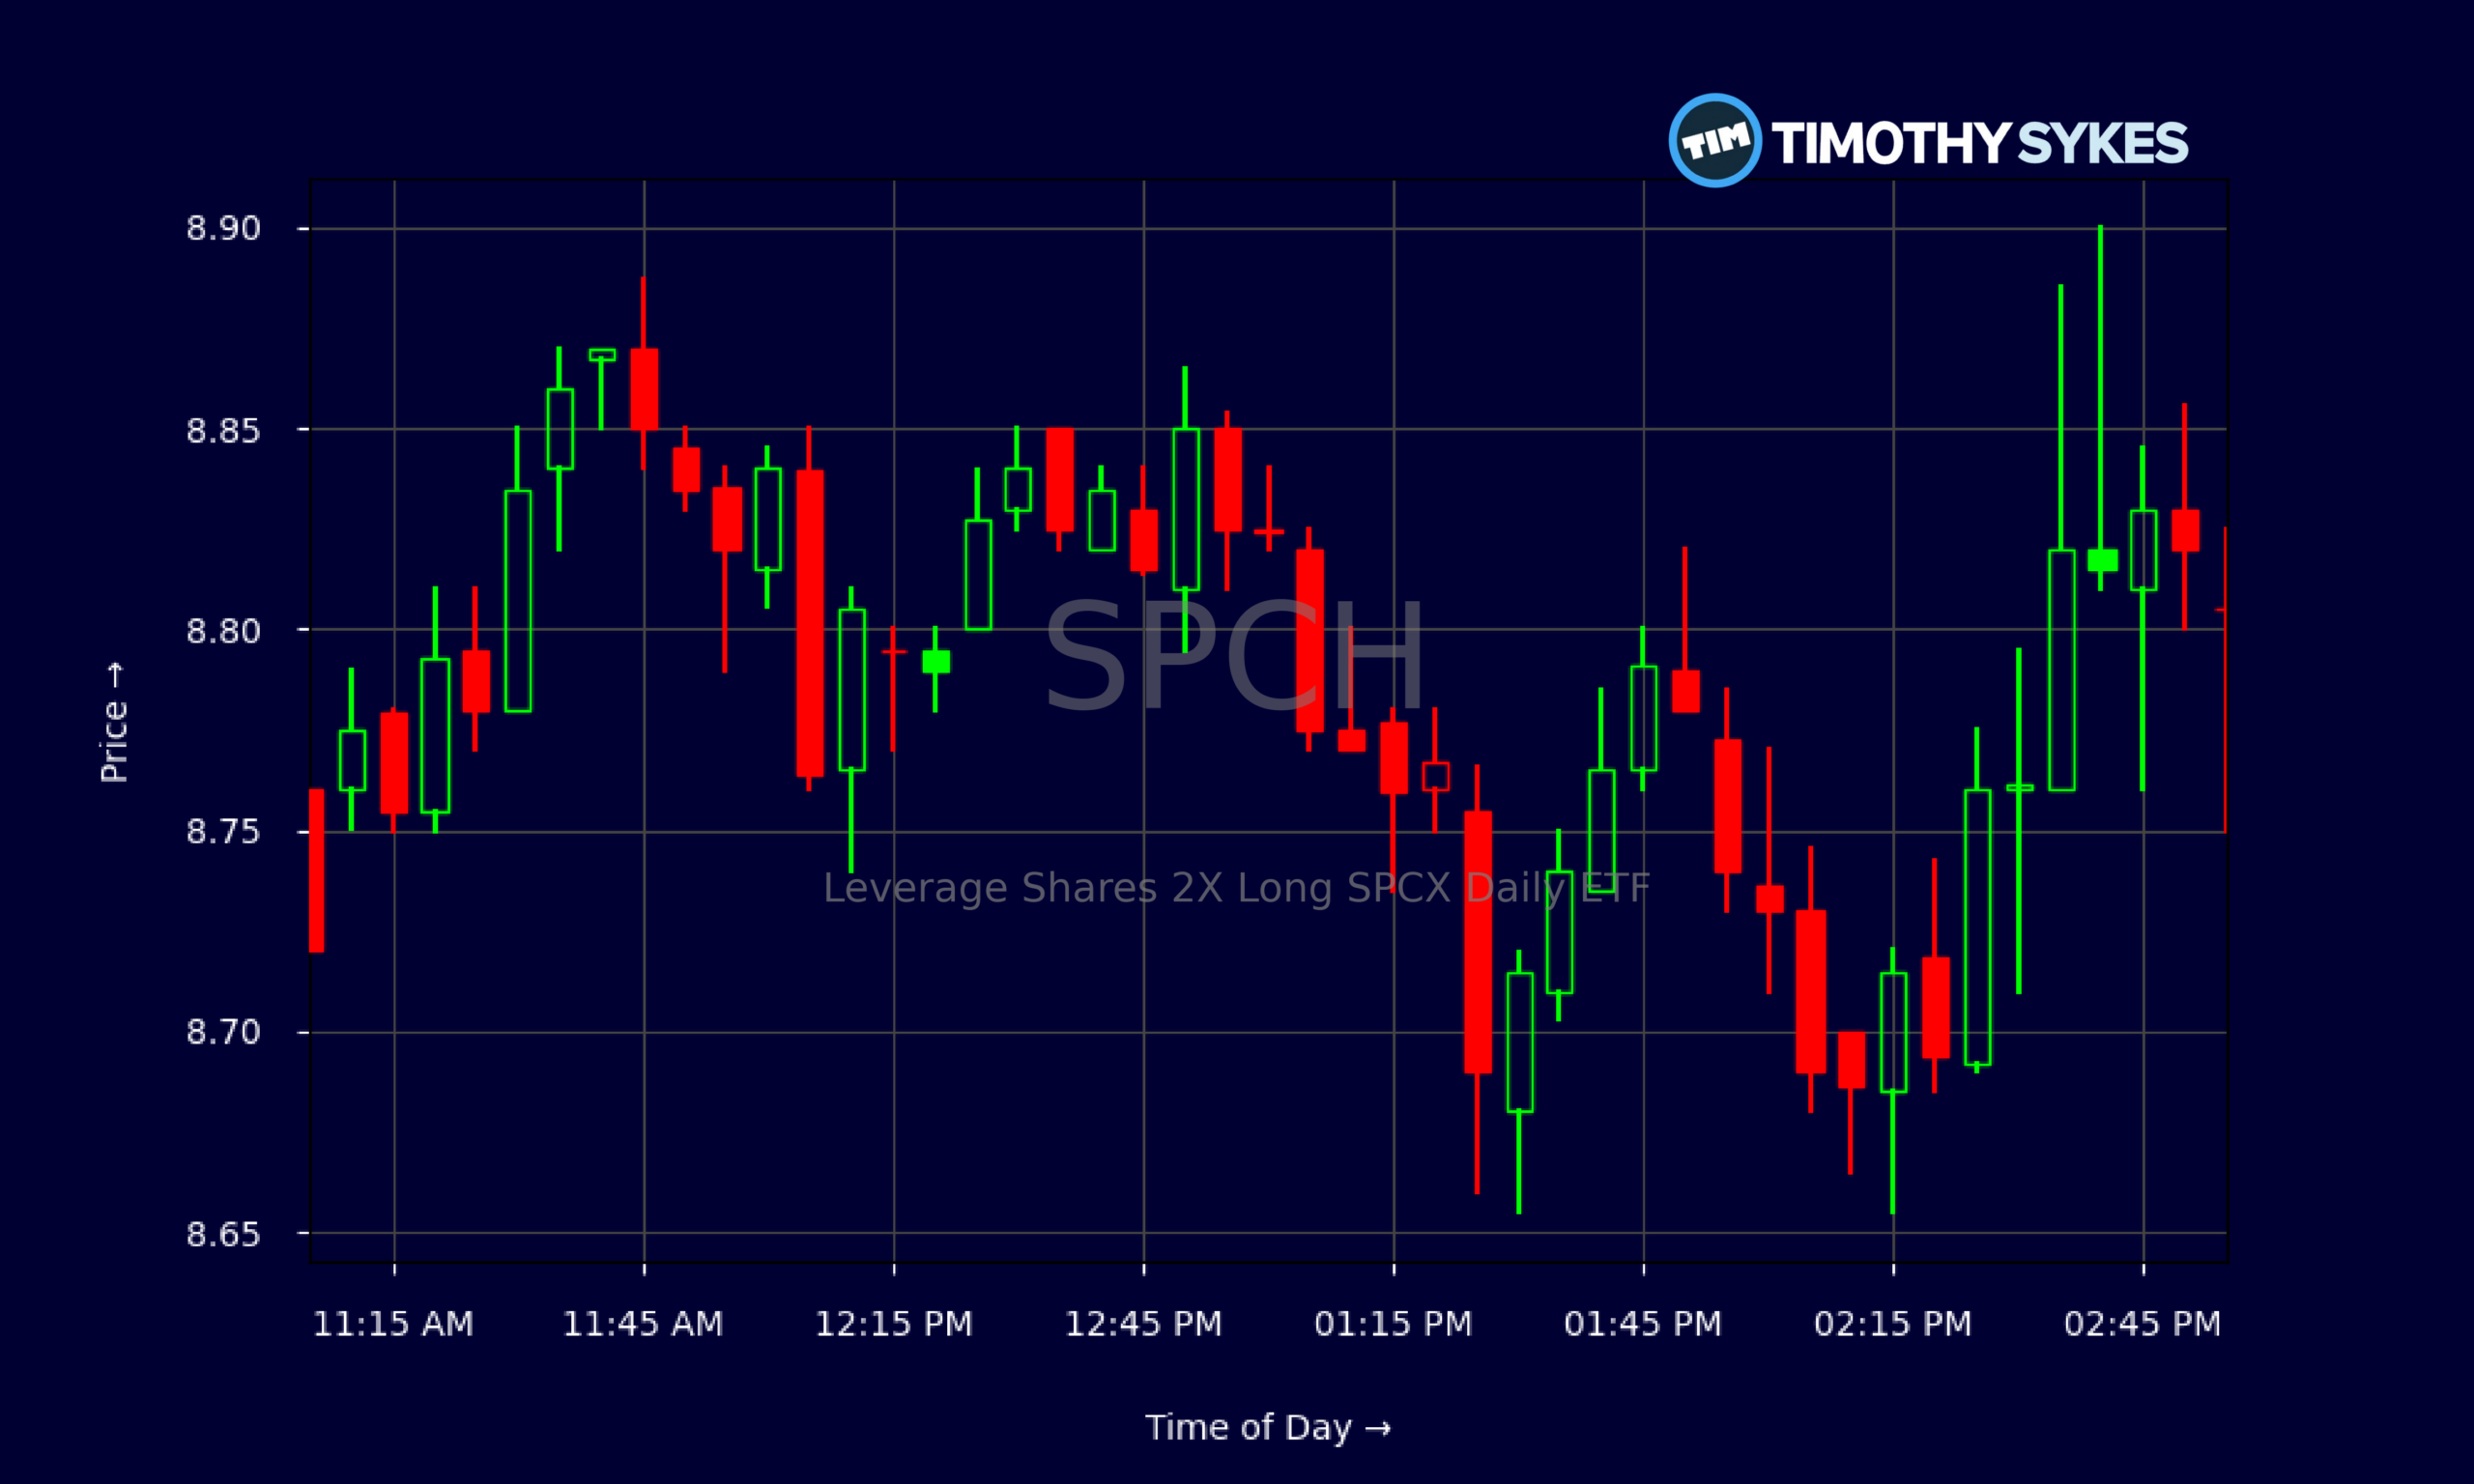
Live Update At 15:02:23 EDT: On Wednesday, October 28, 2026 Leverage Shares 2X Long SPCX Daily ETF stock [BATS Global Markets: SPCH] is trending down by -5.57%! Discover the key drivers behind this movement as well as our expert analysis in the detailed breakdown below.
Quick Financial Overview
Leverage Shares 2X Long SPCX Daily ETF, ticker SPCH, is built for speed, not comfort. It targets 2x daily exposure to a SPAC-focused benchmark, which means normal market chop turns into big swings on this chart. Over the last few weeks, SPCH has fallen from a closing high near $12.91 on 2026/10/06 to about $8.81 on 2026/10/28. That is roughly a one-third drawdown, and it happened fast.
Because SPCH is an ETF with leverage, traditional fundamental ratios like price-to-earnings or margins are basically irrelevant here. The key driver is price action. Traders in SPCH are reacting to the underlying SPAC complex and broader risk-on versus risk-off sentiment.
More Breaking News
The multi-day pattern shows SPCH failing to hold the $11–$13 zone and steadily stepping down to the high-$8s. Each bounce has been weaker, a classic sign that dip buyers are losing control. For active traders, SPCH is acting more like a momentum vehicle than a long-term ETF. When volatility picks up in small caps and SPACs, this name tends to exaggerate the move.
Why Traders Are Watching SPCH Price Action
SPCH has turned into a textbook example of what leveraged ETFs do when the tide goes out. Earlier in October, SPCH pushed into the low-$13s, with a strong close at $12.91 on 2026/10/06 after a multi-day push from roughly $11.07 on 2026/10/05. That ramp attracted momentum traders looking to ride a hot trend in SPAC-related names. But the climb stalled fast. By 2026/10/14, SPCH had already slipped back to a $10.02 close, then briefly reclaimed $11.78–$12.09 intraday on 2026/10/12 before rolling over again.
The real damage came over the last week. SPCH broke down from the $10–$11 band, printing a $10.84 close on 2026/10/21 and then losing the $10 handle completely. On 2026/10/22, it opened above $10 but finished at $8.84, a wide-range red day that signaled trapped longs and aggressive selling. Since then, SPCH has mostly traded in the $8.70–$9.50 range, with Friday’s 2026/10/28 close at $8.8099 confirming a lower base.
Zoom in to the 5‑minute chart, and you see the psychology in real time. Early in the session, SPCH faded from the low-$9s to the mid-$8s, then spent the afternoon chopping between roughly $8.69 and $8.85. That tight band shows indecision — short sellers cautious about pressing much lower, while longs are hesitant to chase bounces. For nimble traders, that consolidation in SPCH sets up potential scalp trades on clear breaks, either above the intraday range or through the lows.
Conclusion
SPCH is not a slow, steady ETF you tuck away and forget. Leverage Shares 2X Long SPCX Daily ETF is built for active trading, and the recent chart backs that up. The multi-week slide from above $12 to under $9 shows what happens when momentum leaves a leveraged product tied to a speculative corner of the market. Every mis-timed entry in SPCH gets punished quickly, while disciplined traders who respect risk have room to exploit the volatility. As millionaire penny stock trader and teacher Tim Sykes, says, “You must adapt to the market; the market will not adapt to you.” That mindset is crucial when dealing with a leveraged product like SPCH, where stubbornness can be far more costly than flexibility.
Right now, SPCH is holding a fragile shelf in the high-$8s. If that area breaks with volume, prior lows around the mid-$8s on recent days become the next spot to watch. On the upside, prior resistance near $9.50 and then $10 stand out as big over-under lines. SPCH traders should keep in mind that the ETF is designed to track 2x daily moves, not long-term performance, so trends can decay and reverse sharply.
As Tim Sykes loves to remind traders, “Rule #1 is cut losses quickly — all of my top students follow this rule.” SPCH is a live case study of that mindset. Whether you are stalking breakouts, breakdowns, or simple range trades, Leverage Shares 2X Long SPCX Daily ETF rewards those who plan their exits before they enter and treat every trade as an educational opportunity, not a prediction machine. This analysis is for educational and research purposes only, and traders should always do their own homework on SPCH before taking any position.
This is stock news, not investment advice. Timothy Sykes News delivers real-time stock market news focused on key catalysts driving short-term price movements. Our content is tailored for active traders and investors seeking to capitalize on rapid price fluctuations, particularly in volatile sectors like penny stocks. Readers come to us for detailed coverage on earnings reports, mergers, FDA approvals, new contracts, and unusual trading volumes that can trigger significant short-term price action. Some users utilize our news to explain sudden stock movements, while others rely on it for diligent research into potential investment opportunities.
Dive deeper into the world of trading with Timothy Sykes, renowned for his expertise in penny stocks. Explore his top picks and discover the strategies that have propelled him to success with these articles:
- Penny Stocks Trading Guide
- Best Penny Stocks Under $1 to Buy Today
- Top 8 Penny Stocks to Watch on Robinhood
Once you’ve got some stocks on watch, elevate your trading game with StocksToTrade the ultimate platform for traders. With specialized tools for swing and day trading, StocksToTrade will guide you through the market’s twists and turns.
Dig into StocksToTrade’s watchlists here:





Leave a reply