
Leverage Shares 2X Long CBRS Daily ETF stocks have been trading down by -10.08 percent amid negative sentiment from ## Ke news
Key Takeaways
- Leverage Shares 2X Long CBRS Daily ETF has dropped more than 60% this month from its recent peak, shaking out weak hands.
- Daily candles show CBRG in a strong downtrend, with lower highs and lower lows dominating October trading.
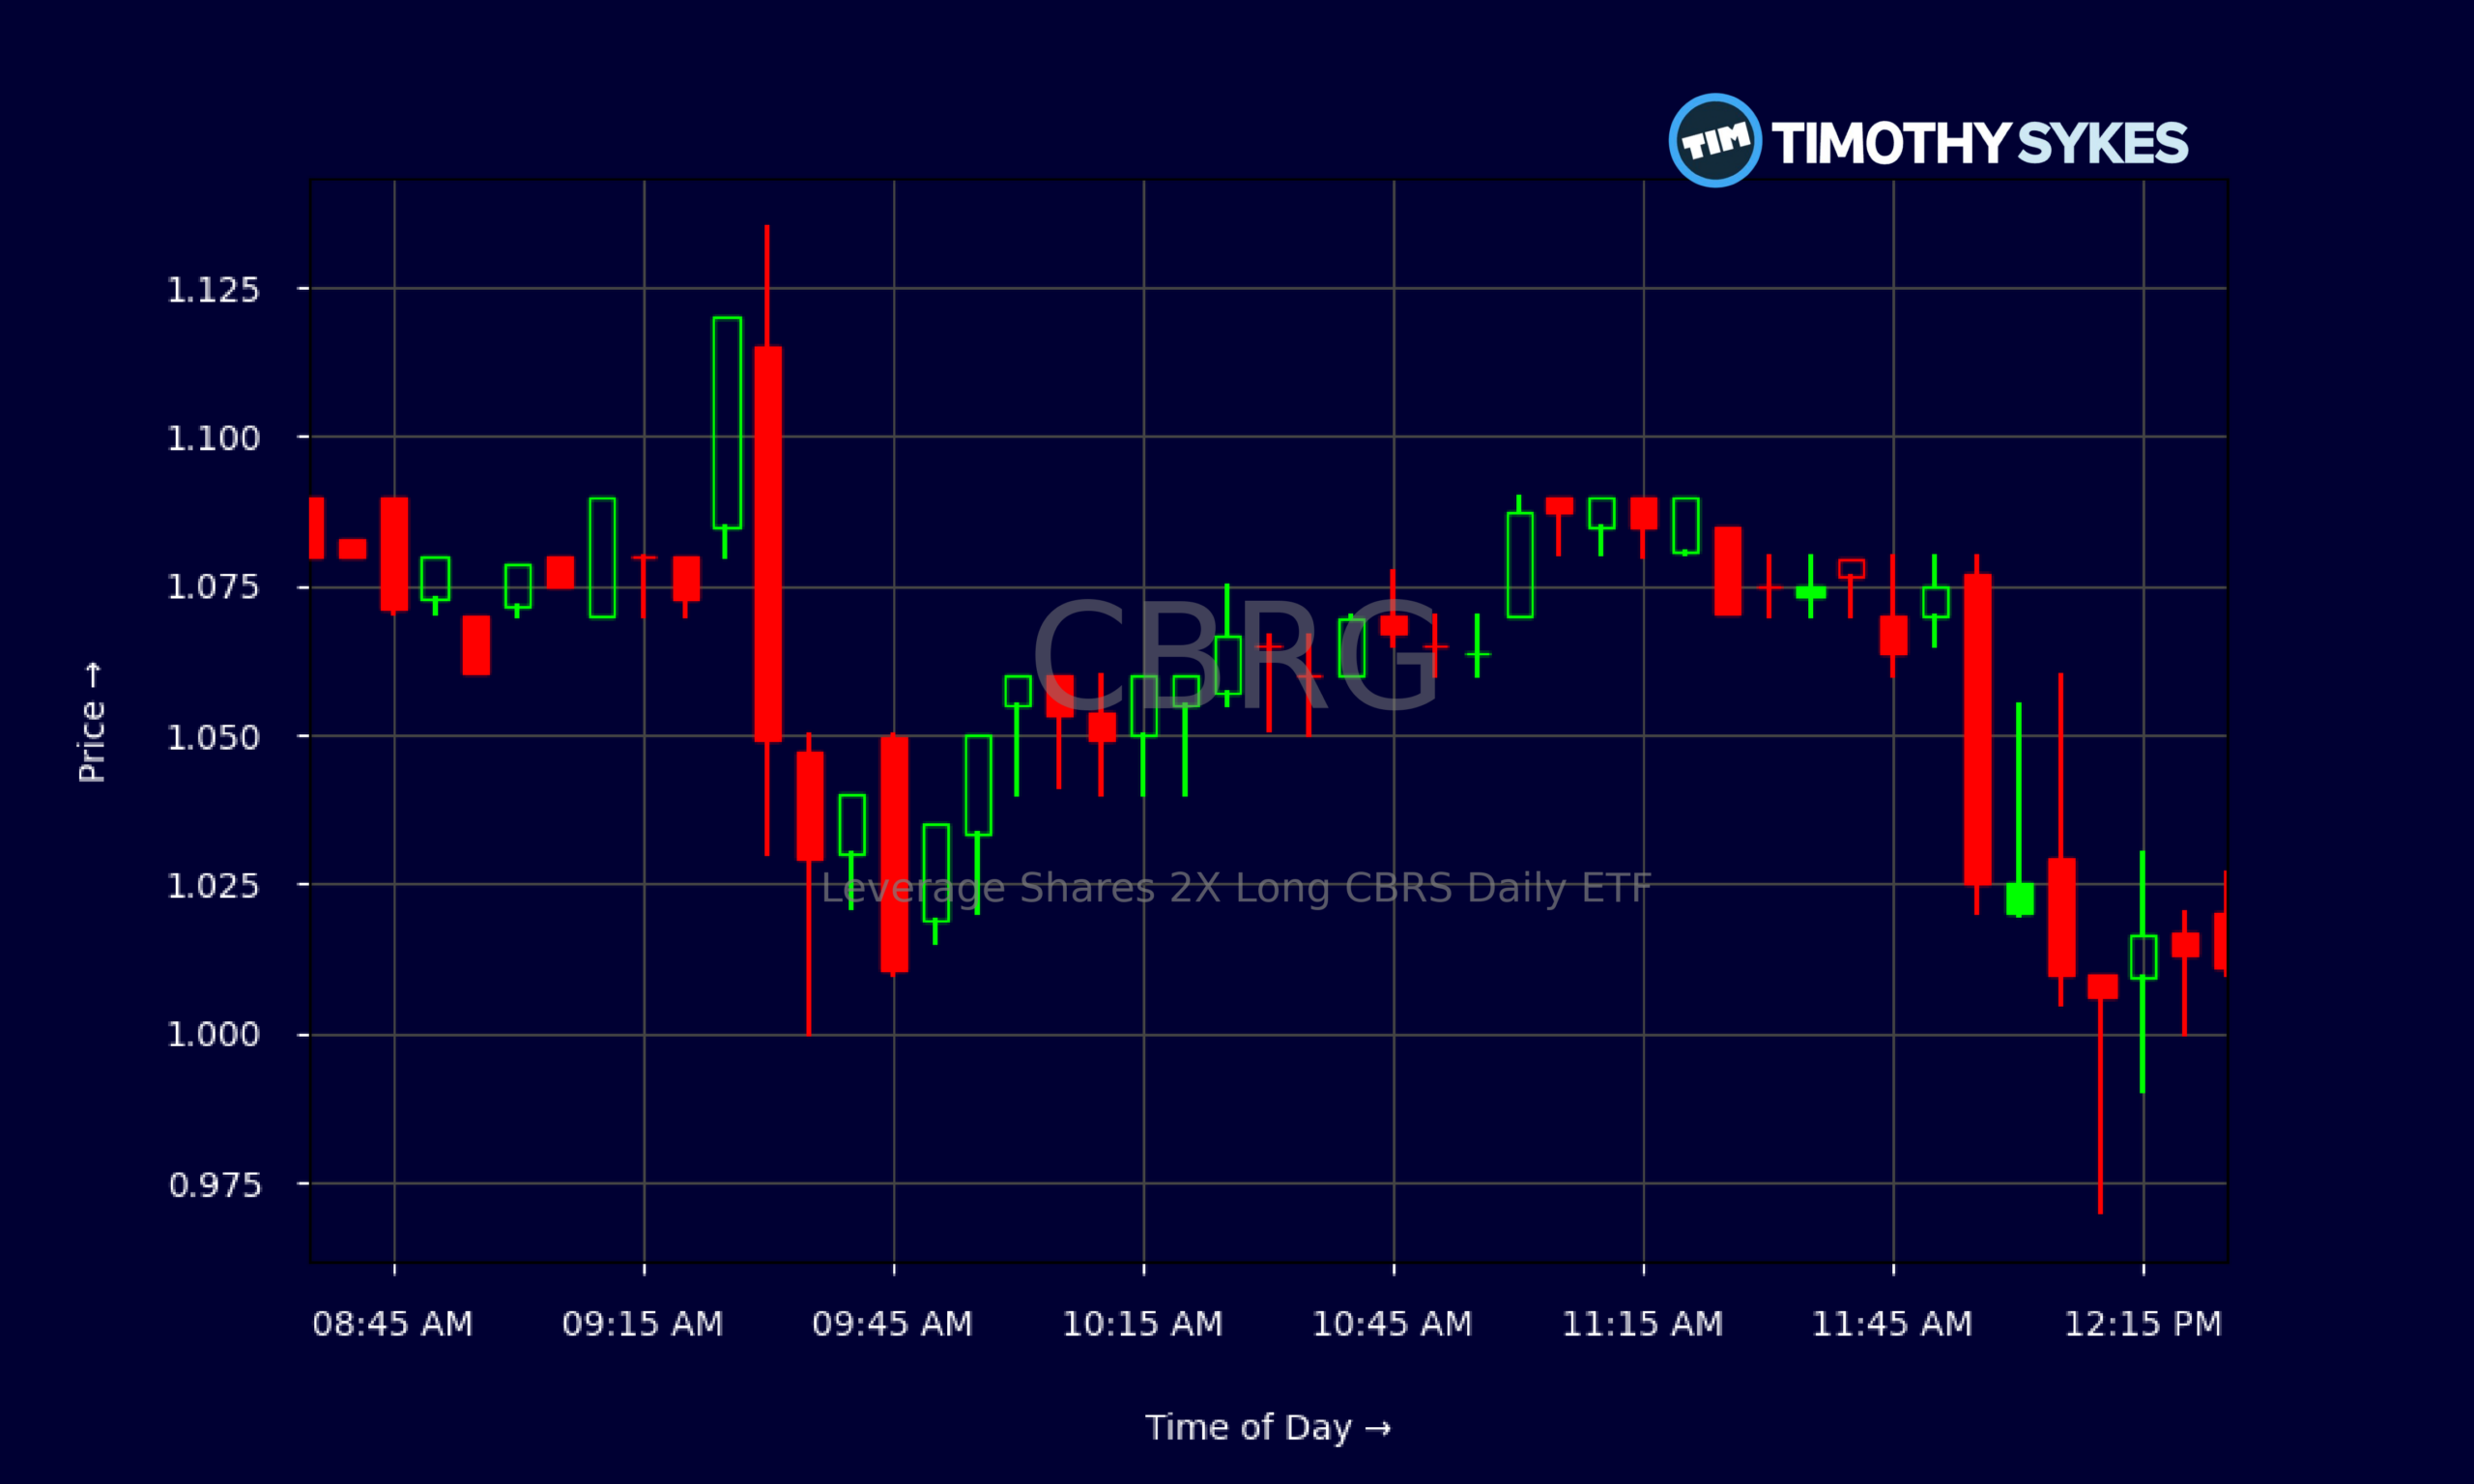
- Intraday tape on CBRG highlights heavy morning selling followed by mid-day stabilization near the $1.00 area.
- Thin fundamental data on CBRG pushes traders to lean heavily on charts, risk management, and strict trading plans.
Live Update At 12:34:24 EDT: On Wednesday, October 28, 2026 Leverage Shares 2X Long CBRS Daily ETF stock [BATS Global Markets: CBRG] is trending down by -10.08%! Discover the key drivers behind this movement as well as our expert analysis in the detailed breakdown below.
Quick Financial Overview
Leverage Shares 2X Long CBRS Daily ETF, trading under the ticker CBRG, is all about price action and leverage, not classic fundamentals. The key ratios are basically blank, so traders do not have earnings, revenue, or profit margins to lean on. That forces a pure technical approach. CBRG is designed to deliver 2x daily exposure, so its chart will swing harder than the underlying it tracks.
Over the last few weeks, CBRG has traded from a high near $2.87 down to roughly $1.00. That is a brutal slide of more than 60%. For a leveraged ETF, this is the reality: when the underlying trend turns against you, losses stack quickly. Daily candles show sustained selling from early October, with almost every bounce getting sold off.
More Breaking News
For active traders, CBRG’s structure means it is best treated as a short-term trading vehicle, not a long-term hold. With no dividend yield, no visible cash flow, and no valuation metrics, the only real edge comes from reading trend, volume, and volatility, then managing risk tightly.
Why Traders Are Watching CBRG’s Volatile Chart
CBRG has turned into a case study in how fast leveraged products can give back parabolic gains. Earlier in the month, Leverage Shares 2X Long CBRS Daily ETF traded in the mid-$2.00s and even touched above $2.80. The slide down toward $1.00 has been steady, not a one-day crash. That tells traders this is more than a simple shakeout; it is a full trend reversal.
Look at the daily progression. From 2026/10/05 to 2026/10/09, CBRG closed between about $2.25 and $2.76, holding relatively high levels. Then the floor started to crack. By 2026/10/12, it closed around $1.78, then $1.64–$1.66 on 2026/10/13–15. Once CBRG broke the $1.50 area, the selling accelerated, with closes grinding down toward $0.93–$0.97 in the most recent sessions. That is a textbook pattern of lower highs and lower lows.
Intraday, today’s 5-minute chart shows CBRG opening near $1.11, popping to $1.135, and then fading all morning. The price slowly bled down into the low $1.00s, eventually testing just under $1.00 before stabilizing around $1.01. Volume is concentrated in the first hour, where most of the range expansion hit. Afternoon trading shows tighter candles, signaling short-term consolidation.
For day traders, this combination of big daily ranges and intraday mean reversion makes CBRG a possible scalp ticker. For swing traders, the message is clear: the trend is down until CBRG can reclaim prior resistance levels and hold them.
Conclusion
CBRG, the Leverage Shares 2X Long CBRS Daily ETF, is reminding traders why leveraged products demand discipline. The ETF has lost more than half its value this month, and the chart does not yet show a confirmed bottom. Daily action favors sellers, and every bounce on CBRG has met overhead pressure. That is not where swing traders want to get stubborn or emotional.
The lack of usable financial reports and key ratios around CBRG pushes the focus squarely onto technical analysis. Support, resistance, volume, and intraday momentum matter more here than classic balance-sheet deep dives. Trend-followers will see a clean downtrend. Countertrend traders will see possible short-term bounces, but they face heavy risk if they overstay.
In the Tim Sykes world, the lesson from CBRG is simple: trade the pattern, not the hope. As millionaire penny stock trader and teacher Tim Sykes, says, “Preparation plus patience leads to big profits.”. As Tim likes to say, “I don’t trade stories, I trade price action and I cut losses quickly when the trade proves me wrong.” CBRG’s recent slide is a live example of why that mindset matters. For traders studying this ETF, the priority is clear — respect the leverage, respect the volatility, and let the chart, not emotions, set your plan.
This is stock news, not investment advice. Timothy Sykes News delivers real-time stock market news focused on key catalysts driving short-term price movements. Our content is tailored for active traders and investors seeking to capitalize on rapid price fluctuations, particularly in volatile sectors like penny stocks. Readers come to us for detailed coverage on earnings reports, mergers, FDA approvals, new contracts, and unusual trading volumes that can trigger significant short-term price action. Some users utilize our news to explain sudden stock movements, while others rely on it for diligent research into potential investment opportunities.
Dive deeper into the world of trading with Timothy Sykes, renowned for his expertise in penny stocks. Explore his top picks and discover the strategies that have propelled him to success with these articles:
- Penny Stocks Trading Guide
- Best Penny Stocks Under $1 to Buy Today
- Top 8 Penny Stocks to Watch on Robinhood
Once you’ve got some stocks on watch, elevate your trading game with StocksToTrade the ultimate platform for traders. With specialized tools for swing and day trading, StocksToTrade will guide you through the market’s twists and turns.
Dig into StocksToTrade’s watchlists here:





Leave a reply