
Leverage Shares 2X Long SPCX Daily ETF climbs as upbeat SPAC-sector sentiment drives renewed risk appetite; stocks have been trading up by 8.96 percent.
Key Takeaways
- Leverage Shares 2X Long SPCX Daily ETF (SPCH) has backed off sharply from early-October highs near $12, showing a clear downtrend on the daily chart.
- Intraday trading in SPCH around $8.00–$8.30 shows tight consolidation, signaling a tug-of-war between dip-buyers and profit-takers.
- Thin fundamental data leaves chart action as the primary guide for traders tracking SPCH momentum.
- Recent price swings in SPCH highlight the amplified risk that comes with a leveraged ETF tied to underlying SPAC exposure.
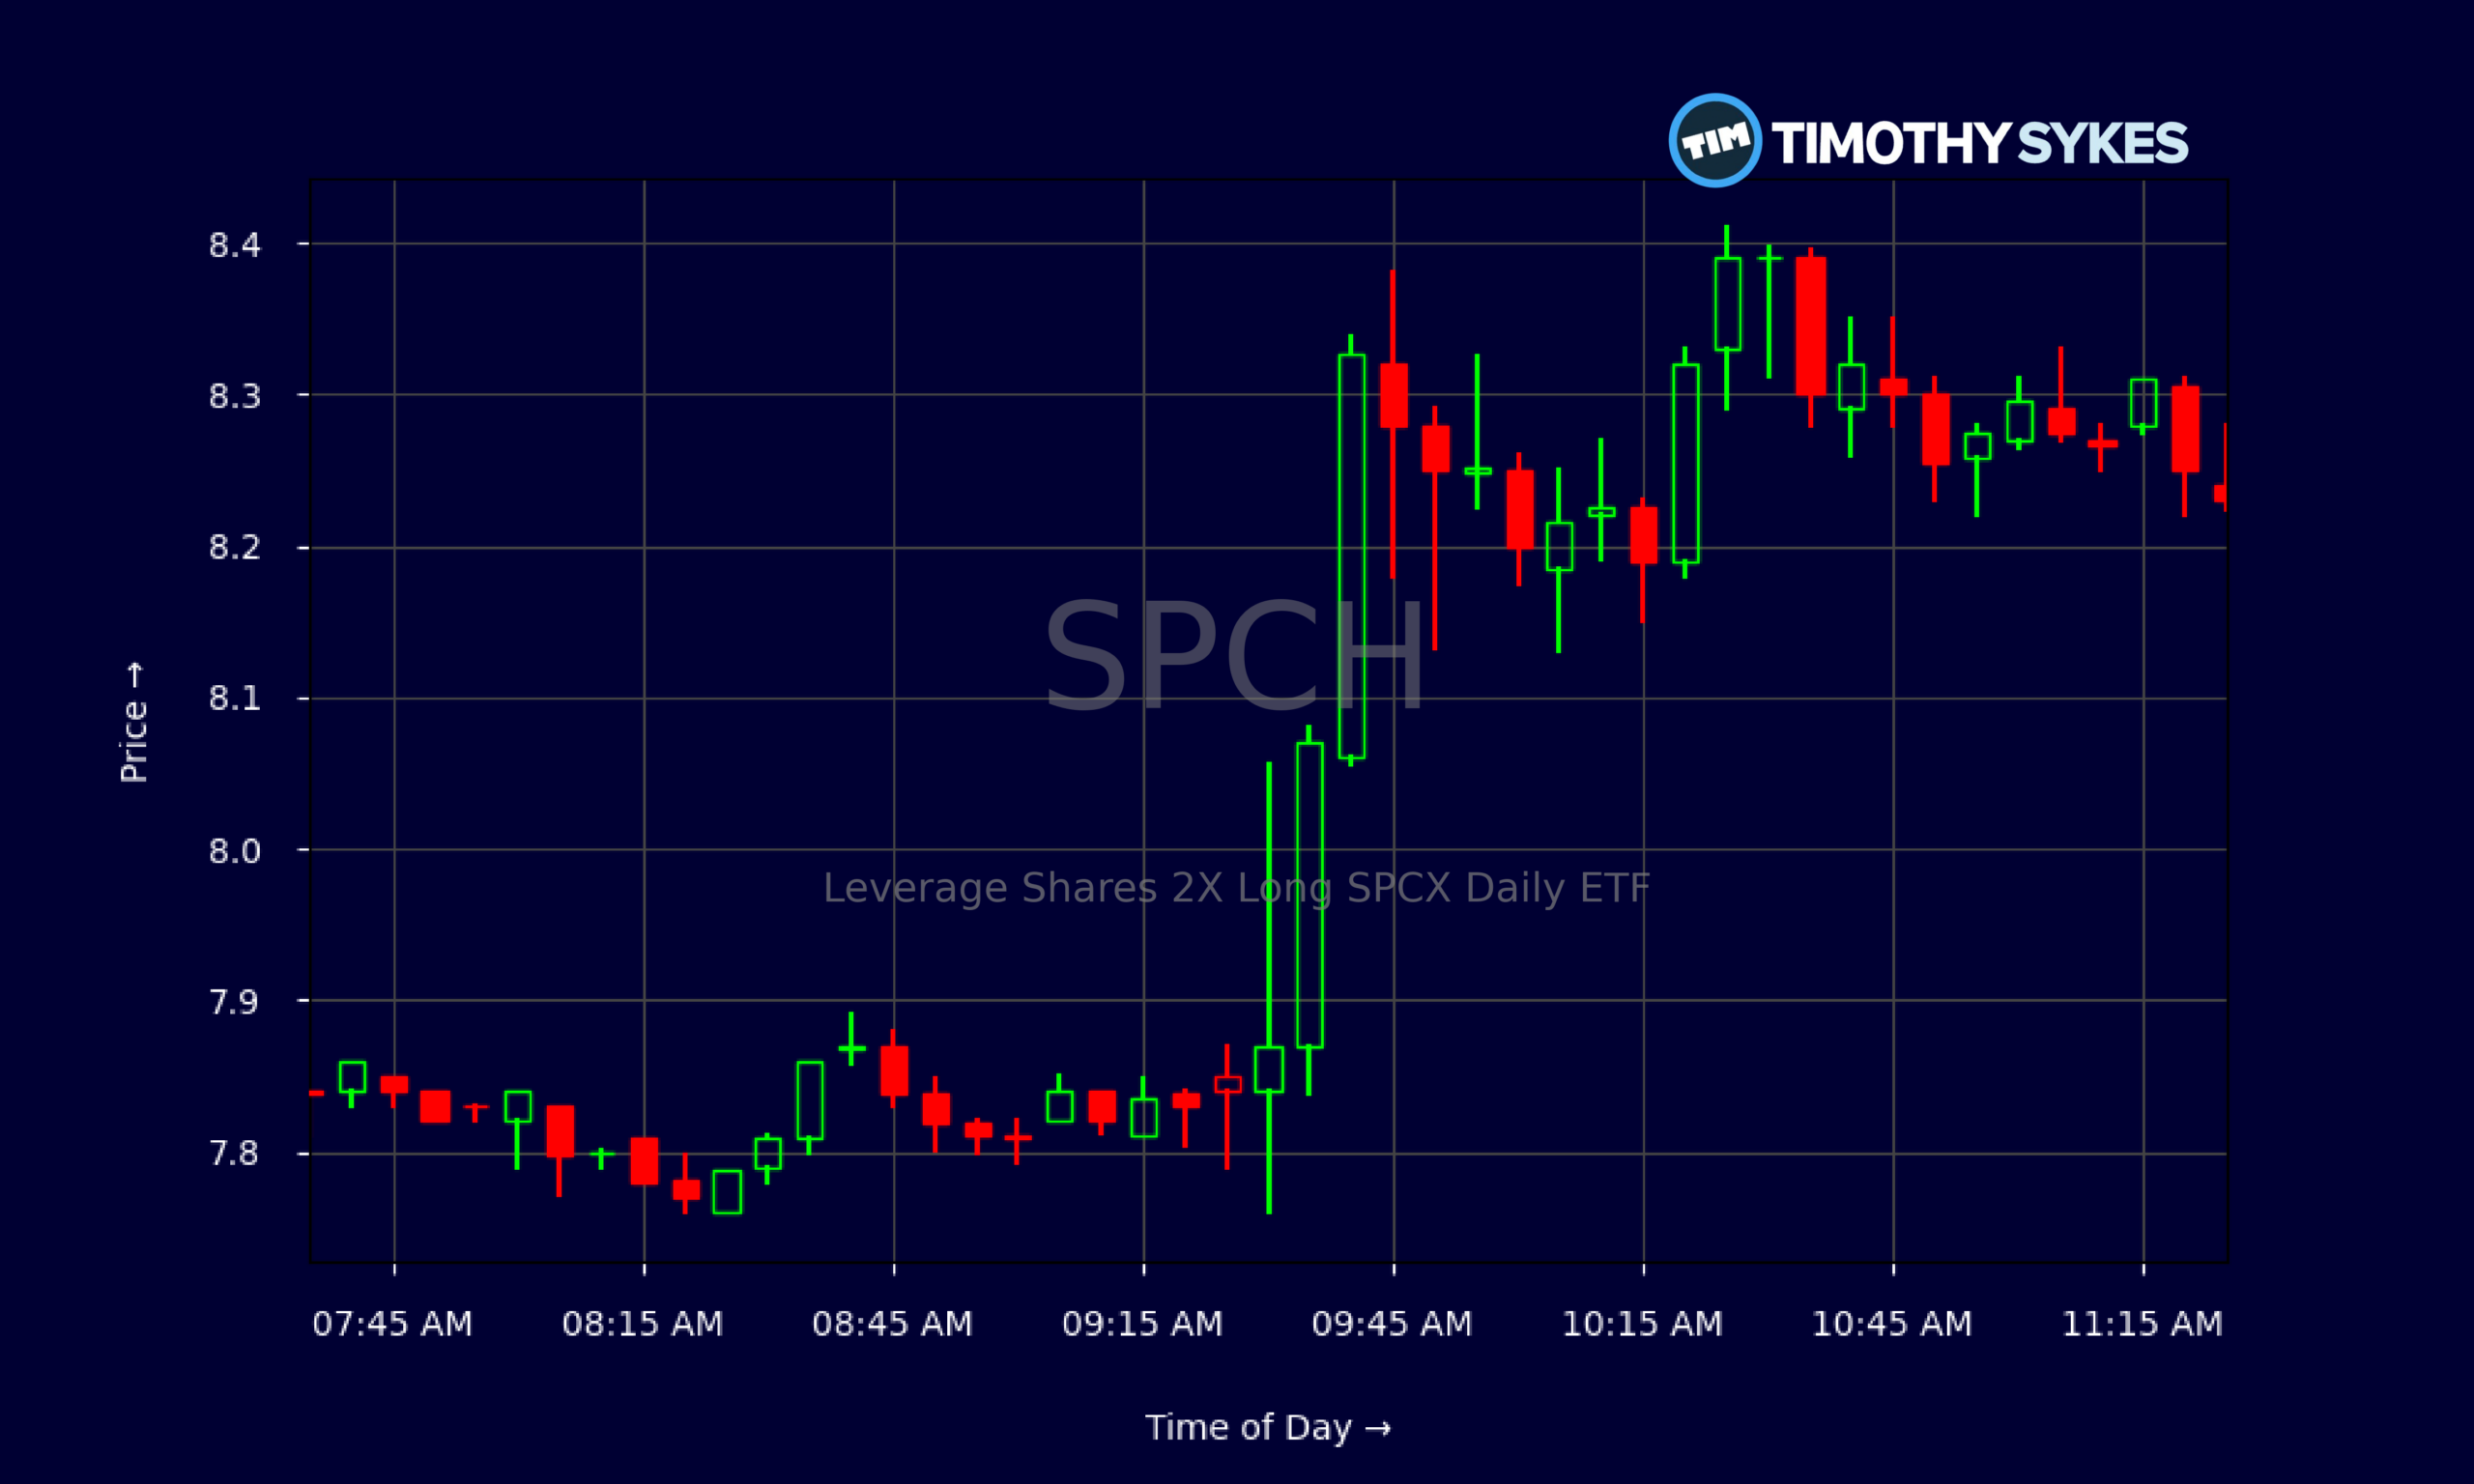
Live Update At 11:35:00 EST: On Monday, November 02, 2026 Leverage Shares 2X Long SPCX Daily ETF stock [BATS Global Markets: SPCH] is trending up by 8.96%! Discover the key drivers behind this movement as well as our expert analysis in the detailed breakdown below.
Quick Financial Overview
SPCH, the Leverage Shares 2X Long SPCX Daily ETF, is built for volatility. It aims to deliver twice the daily performance of a SPAC-focused benchmark, so swings in SPCH are naturally bigger than the underlying. Over the last several weeks, SPCH has pulled back from the low-$12s to the high-$7s and low-$8s, a steep slide that shows how fast leveraged products can move when sentiment shifts.
The daily chart for SPCH tells the story. After trading as high as roughly $12.20 in early October, the ETF has made a series of lower highs and lower lows, with recent closes sitting around $8.27. That’s a sizable percentage drawdown, and traders in SPCH need to respect that risk.
More Breaking News
Fundamental key ratios and financial reports are largely blank, which is typical for many leveraged ETFs like SPCH. The value here is not classic cash flow or earnings. Instead, SPCH is a tactical trading vehicle tied to short-term moves in special purpose acquisition company exposure. For active traders, that puts the spotlight directly on price action, volatility, and liquidity when planning trades in SPCH.
Why Traders Are Watching SPCH Price Action
SPCH has become a clean case study in how leveraged ETFs trade when momentum fades. Earlier in October, Leverage Shares 2X Long SPCX Daily ETF was pushing above $11 and even briefly over $12. Those levels attracted momentum traders chasing upside in SPCH as SPAC-related sentiment perked up. But since then, the chart has flipped.
Daily candles now show a staircase lower. SPCH closed at $11.57, then $10.60, then $10.02, then $9.53, and so on, grinding down toward the current $8.27 zone. For traders, that pattern screams “respect the trend.” When a leveraged product like SPCH starts making consistent lower highs, fading bounces becomes more attractive than buying dips blindly.
Zoom in to the intraday data and the character of SPCH changes again. On the most recent session, SPCH opened under $8.00, shook out early around $7.76–$7.87, then steadily pushed into the $8.20–$8.40 range. Multiple five-minute candles stalled near $8.35–$8.41 before closing around $8.27. That intraday action shows responsive buying at sub-$8 prices, but also shows clear overhead pressure every time SPCH pushes into the mid-$8s.
For short-term traders, this creates a defined battlefield. SPCH support sits near the pre-market and open zone around $7.80–$7.90, while intraday resistance lives near $8.35–$8.40. Breaks above or below those ranges can trigger fast moves, because SPCH is leveraged and attracts momentum-focused trading strategies.
Conclusion
Traders who focus on price action over stories will find SPCH an interesting chart right now. Leverage Shares 2X Long SPCX Daily ETF has unwound a big chunk of its October run, shifting from an uptrend into a controlled, grinding pullback. For disciplined traders, that’s not a problem; it’s a roadmap. SPCH is telegraphing its levels clearly.
The lack of traditional financial metrics for SPCH forces a simple, technical approach. Support in the high-$7s, resistance in the mid-$8s, and a broader downtrend from the $12 area give traders a framework. SPCH remains a leveraged product, so position sizing and tight risk management matter more than usual. When leverage works for you in SPCH, gains can stack fast. When it works against you, losses can snowball just as quickly. As millionaire penny stock trader and teacher Tim Sykes, says, “It’s better to go home at zero than to go home in the red.”. That mindset fits this product perfectly: walking away flat is a win compared to forcing trades and digging a deeper hole in a fast-moving, leveraged ETF.
This is exactly the type of setup Tim Sykes and the trading community drill into: a volatile chart, clear intraday levels, and a product designed for short-term moves, not long-term holding. As Sykes often says, “The market rewards the prepared trader, not the hopeful one.” SPCH is rewarding preparation right now — traders who map their levels, honor their stops, and treat this ETF as a trading vehicle, not a long-term parking spot, are the ones most likely to stay in the game.
This is stock news, not investment advice. Timothy Sykes News delivers real-time stock market news focused on key catalysts driving short-term price movements. Our content is tailored for active traders and investors seeking to capitalize on rapid price fluctuations, particularly in volatile sectors like penny stocks. Readers come to us for detailed coverage on earnings reports, mergers, FDA approvals, new contracts, and unusual trading volumes that can trigger significant short-term price action. Some users utilize our news to explain sudden stock movements, while others rely on it for diligent research into potential investment opportunities.
Dive deeper into the world of trading with Timothy Sykes, renowned for his expertise in penny stocks. Explore his top picks and discover the strategies that have propelled him to success with these articles:
- Penny Stocks Trading Guide
- Best Penny Stocks Under $1 to Buy Today
- Top 8 Penny Stocks to Watch on Robinhood
Once you’ve got some stocks on watch, elevate your trading game with StocksToTrade the ultimate platform for traders. With specialized tools for swing and day trading, StocksToTrade will guide you through the market’s twists and turns.
Dig into StocksToTrade’s watchlists here:




Leave a reply