

AT&T Inc. stocks have been trading down by -7.83 percent amid mounting concerns over network outages and regulatory scrutiny.
Key Takeaways
- Shares of AT&T, Verizon, and T-Mobile dropped 10–13% after SpaceX agreed to acquire a nationwide low-band spectrum portfolio, stoking fears that Starlink Mobile could disrupt terrestrial wireless networks.
- Scotiabank lowered its AT&T price target, warning that SpaceX’s spectrum purchase makes its hybrid satellite–terrestrial network a more credible long-term competitive threat to major U.S. carriers.
- Bernstein downgraded AT&T from Outperform to Market Perform and cut its price target to $24, citing Starlink competition, pricing pressure, and seasonal Q4 headwinds.
- AT&T reported higher Q3 adjusted earnings and revenue and raised full-year guidance, but the stock still fell 5–6.5% as postpaid phone subscriber growth missed expectations.
- AT&T expects Q4 EBITDA to be hit by unfavorable vendor dispute settlements, signaling higher costs or weaker recoveries on top of mounting competitive pressure.
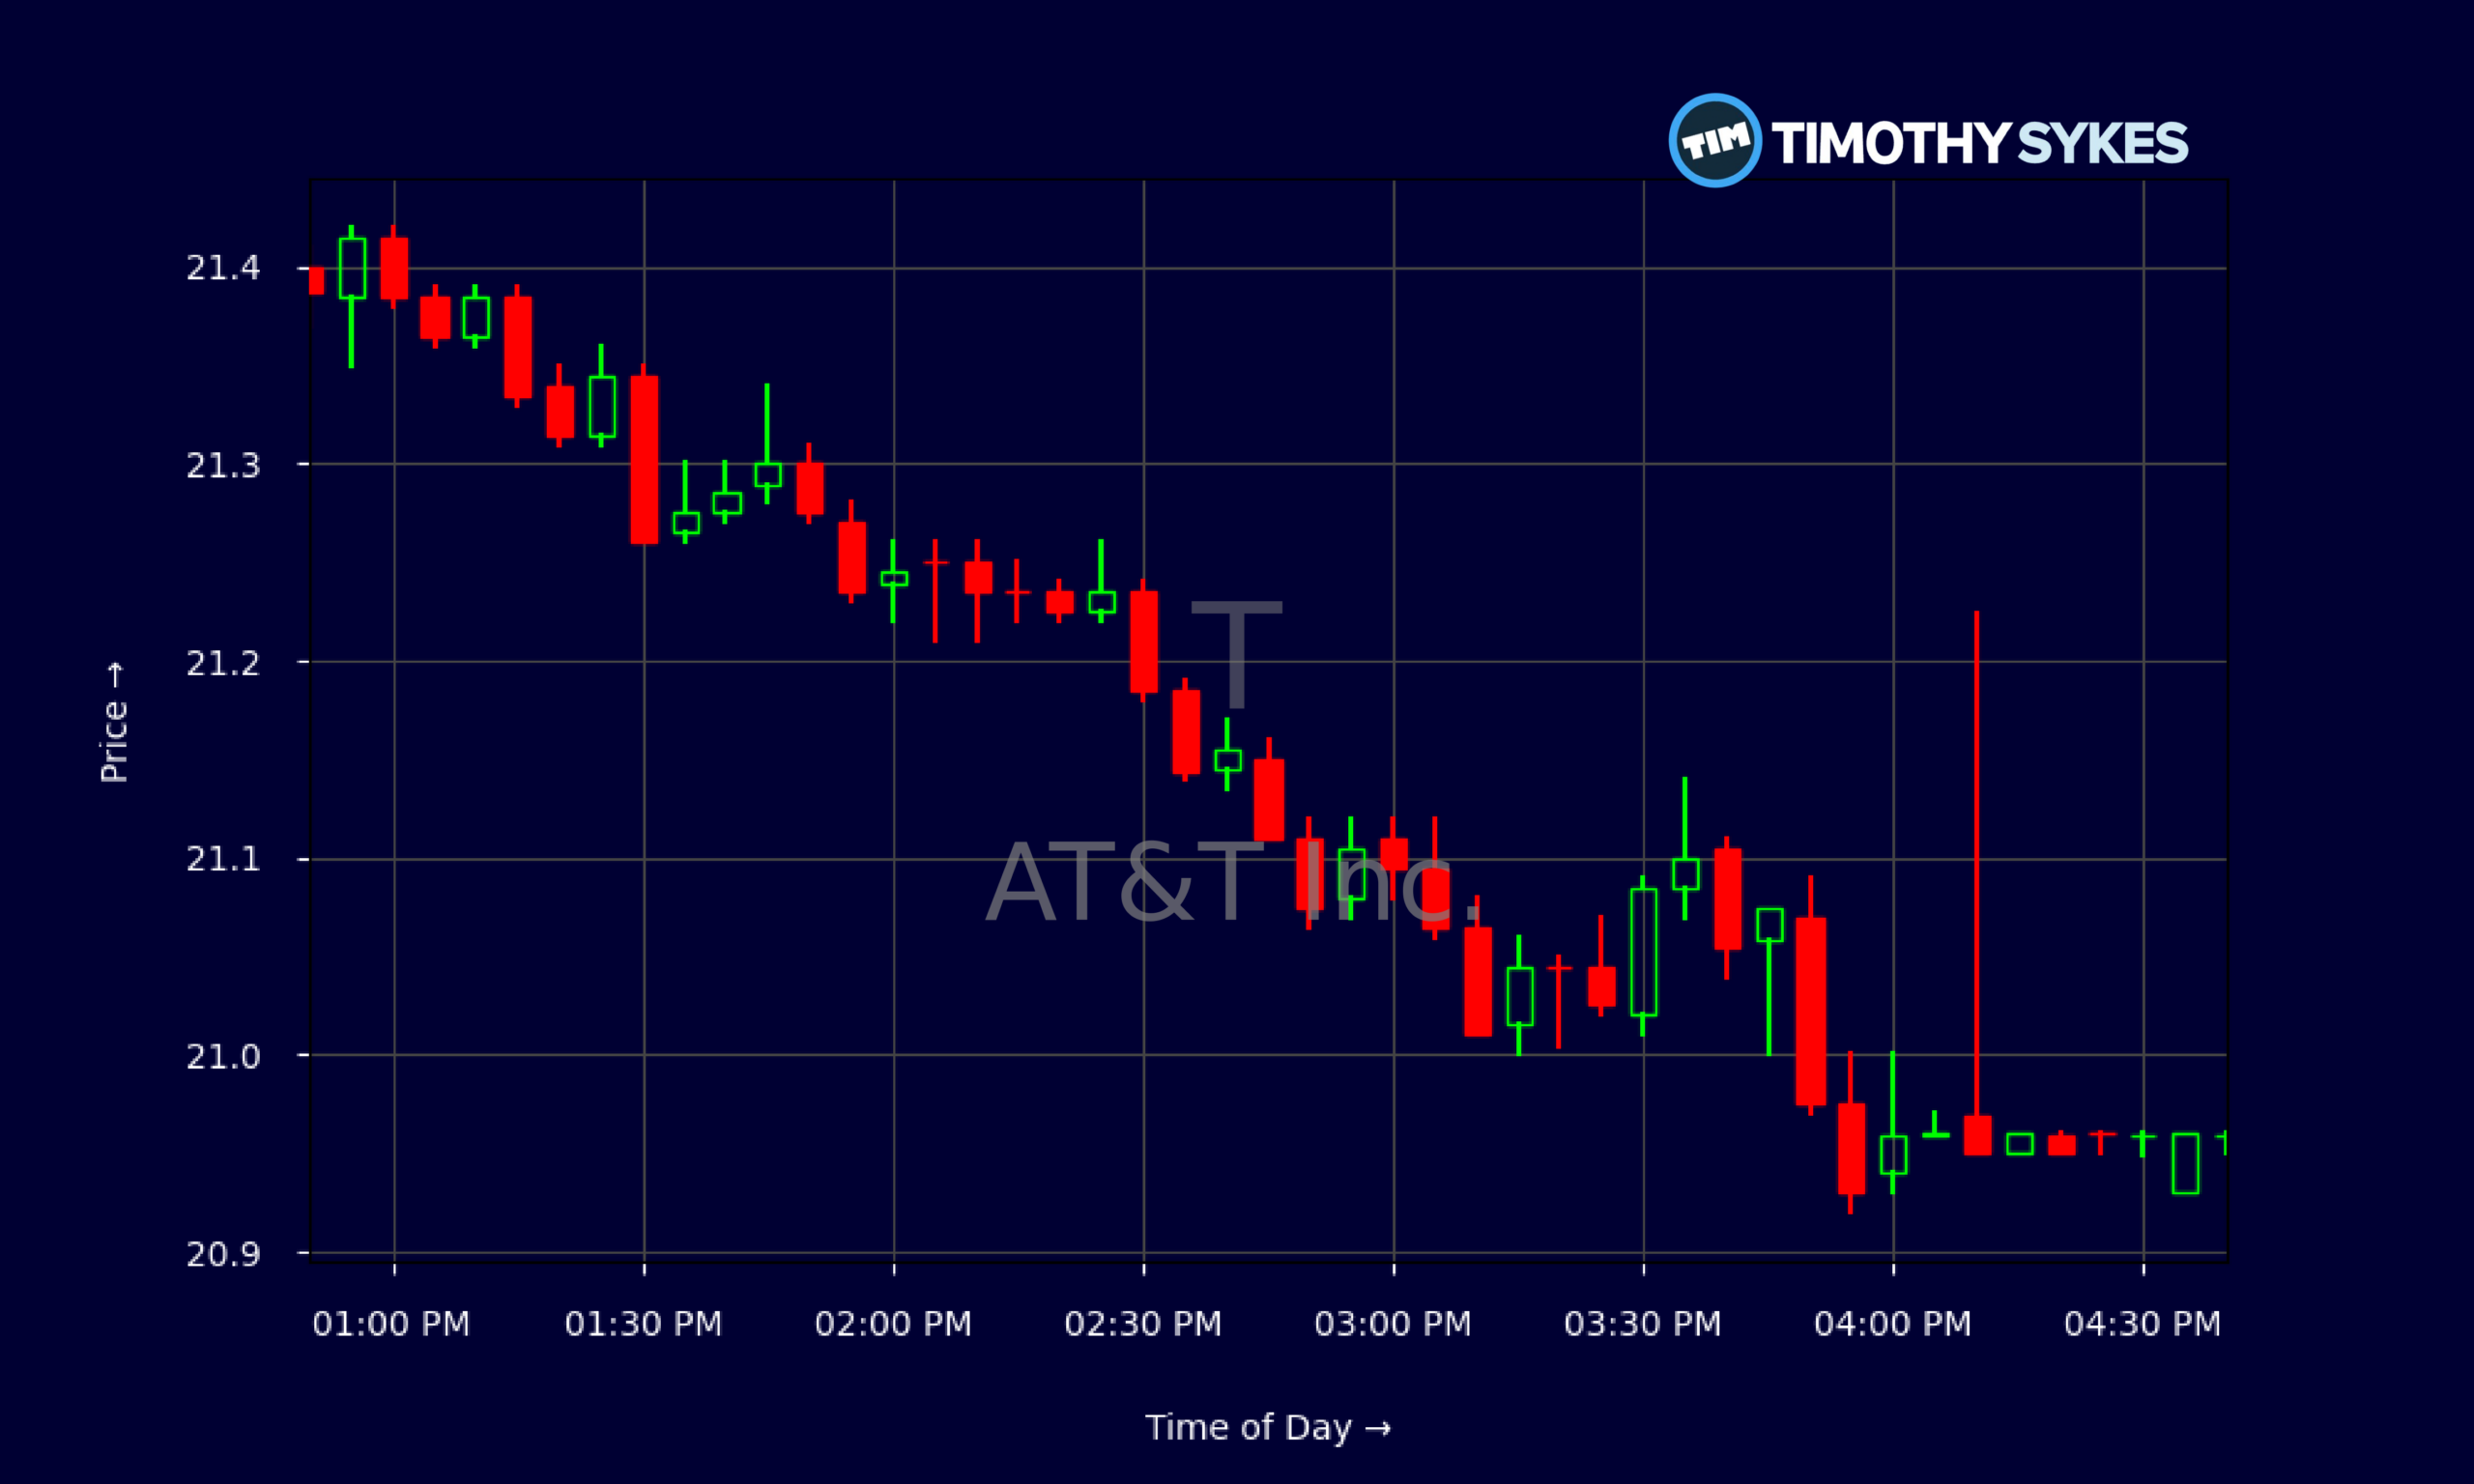
Live Update At 16:46:46 EDT: On Friday, October 23, 2026 AT&T Inc. stock [NYSE: T] is trending down by -7.83%! Discover the key drivers behind this movement as well as our expert analysis in the detailed breakdown below.
Quick Financial Overview
AT&T Inc. (T) is trading like a stock in transition. Over the past few weeks, T slid from the mid-$24s to around $20.93, a drop of roughly 14%, even as the company printed stronger Q3 numbers. That disconnect is what traders need to study.
On the surface, AT&T looks solid. The company generated about $32.3B in Q3 revenue and posted an EBIT margin near 26%, with EBITDA margin over 40%. Profitability in the core business is still there. AT&T also threw off around $5.46B in free cash flow in the latest quarter, backing a dividend yield near 4.9% on a roughly $1.11 annual payout. The P/E near 7.4 and price-to-cash-flow near 3.5 scream “cheap” on traditional metrics.
More Breaking News
But the chart tells a different story. T has broken down from a tight $24–$25 range into a fast slide, with heavy selling on earnings and on the Starlink headlines. Intraday action around $21 showed early strength that faded into the close, a classic distribution pattern. For active traders, that mix of low valuation, high yield, and clear technical weakness is a warning: the market is repricing risk faster than the income stats can support the stock.
Why Traders Are Watching AT&T So Closely
AT&T Inc. is sitting in the middle of a structural story, and traders love that kind of tension. SpaceX’s move to buy a nationwide 800 MHz low-band spectrum portfolio for Starlink Mobile flipped the switch. In one shot, the market went from “Starlink is a science project” to “Starlink is a real U.S. wireless competitor.”
After that news, shares of AT&T, Verizon, and T-Mobile dropped 10–13%. That’s not noise — that’s a sector-wide reset. T’s reaction shows how sensitive legacy carriers have become to any sign that satellite–terrestrial hybrids might steal share, especially in rural and weak-signal zones where AT&T once had a durable edge.
The sell-side is catching up. Scotiabank cut its AT&T price target and called the SpaceX spectrum deal a credible long-term threat to valuations across the big three. Bernstein followed by downgrading AT&T from Outperform to Market Perform and trimming its target to $24. Those aren’t momentum chasers; they’re big shops telling clients to rethink the old “safe telecom” play.
At the same time, AT&T reported a Q3 earnings and revenue beat and raised full-year guidance. In a bull tape, that usually sparks a squeeze. Instead, T fell 5–6.5% and briefly ranked as the worst S&P 500 name on the day. Why? Postpaid phone subscriber additions missed expectations, and the market is locked in on growth quality, not just headline beats.
Layer on the guidance that Q4 EBITDA will be dented by unfavorable vendor dispute settlements, and you see why T is under pressure. Even without Starlink in the picture, margins are getting squeezed. With Starlink looming, traders are treating every hiccup at AT&T as proof that the moat is shrinking.
This is a classic sentiment reset: fundamentals okay, narrative turning, stock repricing.
Conclusion
For active traders, AT&T Inc. is now a sentiment and headline vehicle as much as a dividend story. The fundamentals—solid EBITDA margins, strong cash flow, and a sub-8 P/E—haven’t collapsed. But T’s slide from roughly $24–$25 to near $21 shows that the market is re-rating the whole U.S. wireless space as Starlink Mobile ramps up.
AT&T’s Q3 beat and raised full-year guidance didn’t help the stock because the crowd focused on weak postpaid phone adds and fresh Q4 EBITDA headwinds from vendor disputes. Add in the Scotiabank target cut and Bernstein downgrade, and you get a clear message: Street confidence in AT&T’s long-term dominance is fading, even if the balance sheet and income statement still look respectable.
That mix is exactly why traders on the Tim Sykes-style grind are paying attention. You’ve got a well-known ticker, rising volatility, and a clean technical breakdown that can create both short-term bounces and sharp fades. The key is to ignore the “it’s cheap” talk and trade the price action, the catalysts, and the risk-reward on each move. As millionaire penny stock trader and teacher Tim Sykes, says, “The goal is not to win every trade but to protect your capital and keep moving forward.” That mindset keeps the focus on disciplined trading rather than stubbornly trying to be right about a narrative.
As Tim Sykes loves to remind traders, “The market doesn’t care about your opinion; it only respects price action and risk management.” For AT&T, that means respecting the downtrend, mapping your levels, and always staying nimble while this Starlink story keeps rewriting the script.
This is stock news, not investment advice. Timothy Sykes News delivers real-time stock market news focused on key catalysts driving short-term price movements. Our content is tailored for active traders and investors seeking to capitalize on rapid price fluctuations, particularly in volatile sectors like penny stocks. Readers come to us for detailed coverage on earnings reports, mergers, FDA approvals, new contracts, and unusual trading volumes that can trigger significant short-term price action. Some users utilize our news to explain sudden stock movements, while others rely on it for diligent research into potential investment opportunities.
Dive deeper into the world of trading with Timothy Sykes, renowned for his expertise in penny stocks. Explore his top picks and discover the strategies that have propelled him to success with these articles:
- Penny Stocks Trading Guide
- Best Penny Stocks Under $1 to Buy Today
- Top 8 Penny Stocks to Watch on Robinhood
Once you’ve got some stocks on watch, elevate your trading game with StocksToTrade the ultimate platform for traders. With specialized tools for swing and day trading, StocksToTrade will guide you through the market’s twists and turns.
Dig into StocksToTrade’s watchlists here:





Leave a reply