

AT&T Inc. faces heightened investor anxiety over mounting debt and 5G investment risks, as stocks have been trading down by -7.83 percent.
What Traders Need To Know
- Shares of AT&T, Verizon, and T-Mobile dropped 10–13% after SpaceX agreed to acquire a nationwide low-band spectrum portfolio, heightening fears that Starlink Mobile could become a disruptive competitor to terrestrial wireless networks, especially in weak-signal and rural areas.
- Scotiabank lowered its AT&T price target and warned that SpaceX’s recent U.S. spectrum purchase makes its hybrid satellite–terrestrial network strategy a more credible long-term competitive threat to major U.S. wireless carriers AT&T, T-Mobile, and Verizon, potentially pressuring sector valuations.
- Bernstein downgraded AT&T from Outperform to Market Perform and cut its price target to $24 from $25, citing growing competitive pressure from SpaceX/Starlink in broadband and wireless, recent pricing pressure among incumbents, and seasonal Q4 headwinds.
- AT&T expects its Q4 EBITDA to be negatively affected due to unfavorable outcomes in vendor dispute settlements, implying higher-than-anticipated costs or lower recoveries.
- AT&T reported higher Q3 adjusted earnings and operating revenue and raised full-year earnings guidance, but its stock fell about 5–6.5% after the release as postpaid phone subscriber growth came in below expectations.
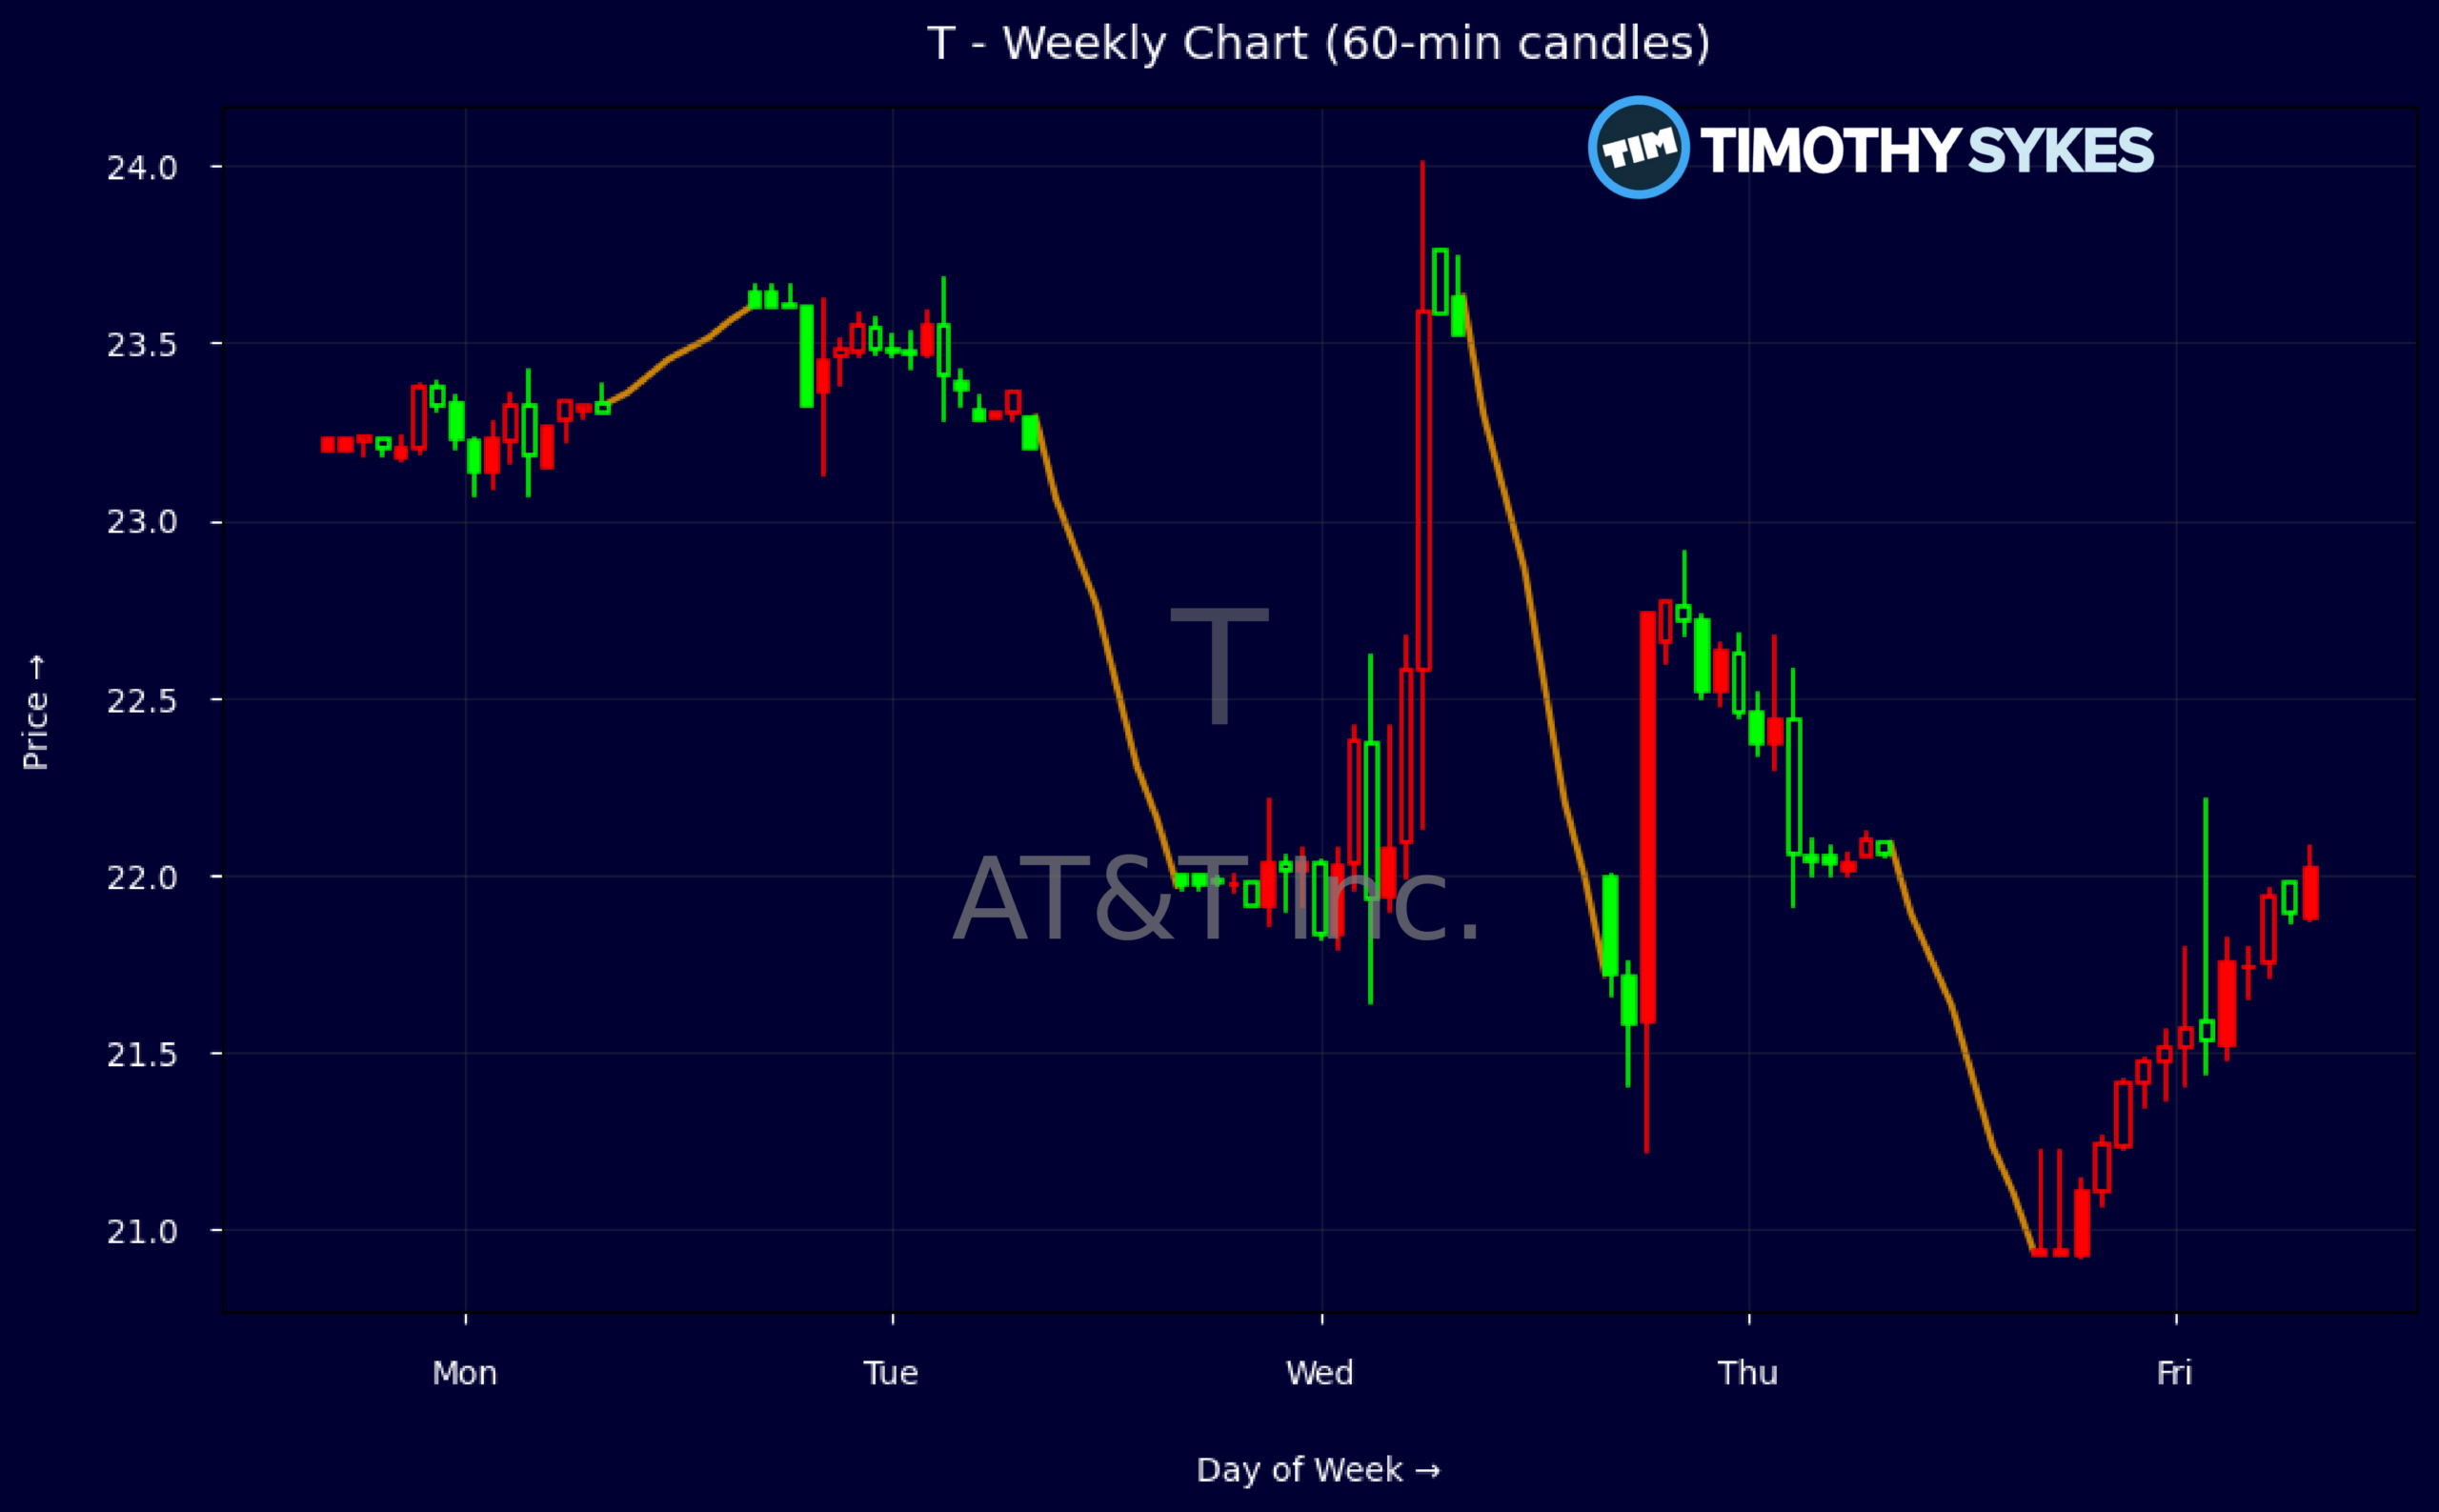
Weekly Update Oct 19 – Oct 23, 2026: On Friday, October 23, 2026 AT&T Inc. stock [NYSE: T] is trending down by -7.83%! Discover the key drivers behind this movement as well as our expert analysis in the detailed breakdown below.
Media & Telecommunications industry expert:
Analyst sentiment – negative
AT&T remains a scale incumbent with $126B in revenue, solid gross margin near 60% and EBITDA margin above 40%, underscoring strong network economics despite low single‑digit top-line growth (3‑yr +1.6%, 5‑yr negative). Returns on equity ~20% and ROIC ~10–11% compare well versus telecom peers, while a P/E of ~7.4x and ~3.5x cash flow imply a discounted valuation. Leverage is still heavy (total debt/equity 1.5x, LT debt ~$169B), but interest coverage of 7.5x and $5.5B quarterly FCF show the balance sheet is manageable and the 4.9% dividend covered.
Technically, the weekly tape shows a sharp breakdown from $23.6 to ~$21, confirming a new short-term downtrend after a failed attempt to hold the mid‑$23s. The sequence of lower highs and lower lows, plus heavy volume on the decline post‑news, indicates distribution rather than a routine pullback. For traders, $23.00–23.25 is the key pivot and first major resistance; tactical shorts are favored below that level with initial support and potential trading buy zone near $20.50–21.00, subject to intraday volume confirmation on 5‑minute candles.
Catalyst-wise, the Starlink Mobile spectrum acquisition is a material long-term overhang, compressing sector multiples and raising uncertainty on rural and fringe‑coverage economics, while vendor dispute settlements are set to weigh on Q4 EBITDA. Relative to telecom and broader media benchmarks, AT&T’s valuation discount and cash generation are compelling but justified by higher competitive and regulatory risk. I view risk/reward as skewed slightly negative near-term; fair value is $21–22 with resistance at $23.5 and stronger support around $20.
More Breaking News
Quick Financial Overview
AT&T Inc. just delivered a classic “good numbers, bad reaction” setup. Q3 revenue landed around $32.3B with higher adjusted earnings and operating revenue, and guidance for the full year moved higher. Yet the stock still sold off 5–6.5% on the day, because postpaid phone subscriber adds missed expectations and the market is fixated on growth quality, not just headline beats. For short-term traders, that disconnect can create sharp mean-reversion bounces, but it also warns that rallies will be sold until subscriber momentum improves.
On the balance sheet and cash flow side, AT&T Inc. still throws off serious cash. Trailing revenue is about $125.6B, with an EBITDA margin above 40% and EBIT margin in the mid‑20s, supported by roughly $10.5B in quarterly operating cash flow and about $5.5B in free cash flow. Valuation screens cheap with a price/earnings near 7 and price/free cash around 5.8, plus a dividend yield near 4.9% on a $1.11 annual payout. But leverage is meaningful: long-term debt sits near $169B and total debt-to-equity is about 1.47, so the market will punish any sign that cash flow durability is at risk.
Price action confirms that pressure. Weekly, T slipped from the mid‑$23s to around $21, then down near $21 again, before closing just under $21 on the latest bar, marking a clear breakdown from prior consolidation. Intraday, the most recent session opened near $22, faded all day, and closed around $20.96, with sellers in control from the open. Layer on management’s warning that Q4 EBITDA will take a hit from vendor dispute outcomes, and you get a stock where every uptick is being tested against Starlink competition risk and near-term margin headwinds.
Conclusion
This is stock news, not investment advice. Timothy Sykes News delivers real-time stock market news focused on key catalysts driving short-term price movements. Our content is tailored for active traders and investors seeking to capitalize on rapid price fluctuations, particularly in volatile sectors like penny stocks. Readers come to us for detailed coverage on earnings reports, mergers, FDA approvals, new contracts, and unusual trading volumes that can trigger significant short-term price action. Some users utilize our news to explain sudden stock movements, while others rely on it for diligent research into potential investment opportunities.
Dive deeper into the world of trading with Timothy Sykes, renowned for his expertise in penny stocks. Explore his top picks and discover the strategies that have propelled him to success with these articles:
- Penny Stocks Trading Guide
- Best Penny Stocks Under $1 to Buy Today
- Top 8 Penny Stocks to Watch on Robinhood
Once you’ve got some stocks on watch, elevate your trading game with StocksToTrade the ultimate platform for traders. With specialized tools for swing and day trading, StocksToTrade will guide you through the market’s twists and turns.
Dig into StocksToTrade’s watchlists here:





Leave a reply