

ClearOne Inc. stocks have been trading up by 21.85 percent following upbeat sentiment around its latest strategic developments.
Key Takeaways
- CLRO has swung from a $5.00 peak to $1.72 in recent sessions, signaling heavy volatility that short-term traders thrive on.
- Recent intraday action shows CLRO bouncing between $2.75 and $4.10, suggesting an active tug-of-war between buyers and sellers.
- ClearOne Inc. reported negative earnings and cash burn, with CLRO relying on new short-term debt to shore up liquidity.
- Balance sheet data shows ClearOne Inc. with thin working capital and negative equity, keeping CLRO firmly in high‑risk territory.
- Active traders are watching whether CLRO can hold above recent lows and build a base for the next momentum move.
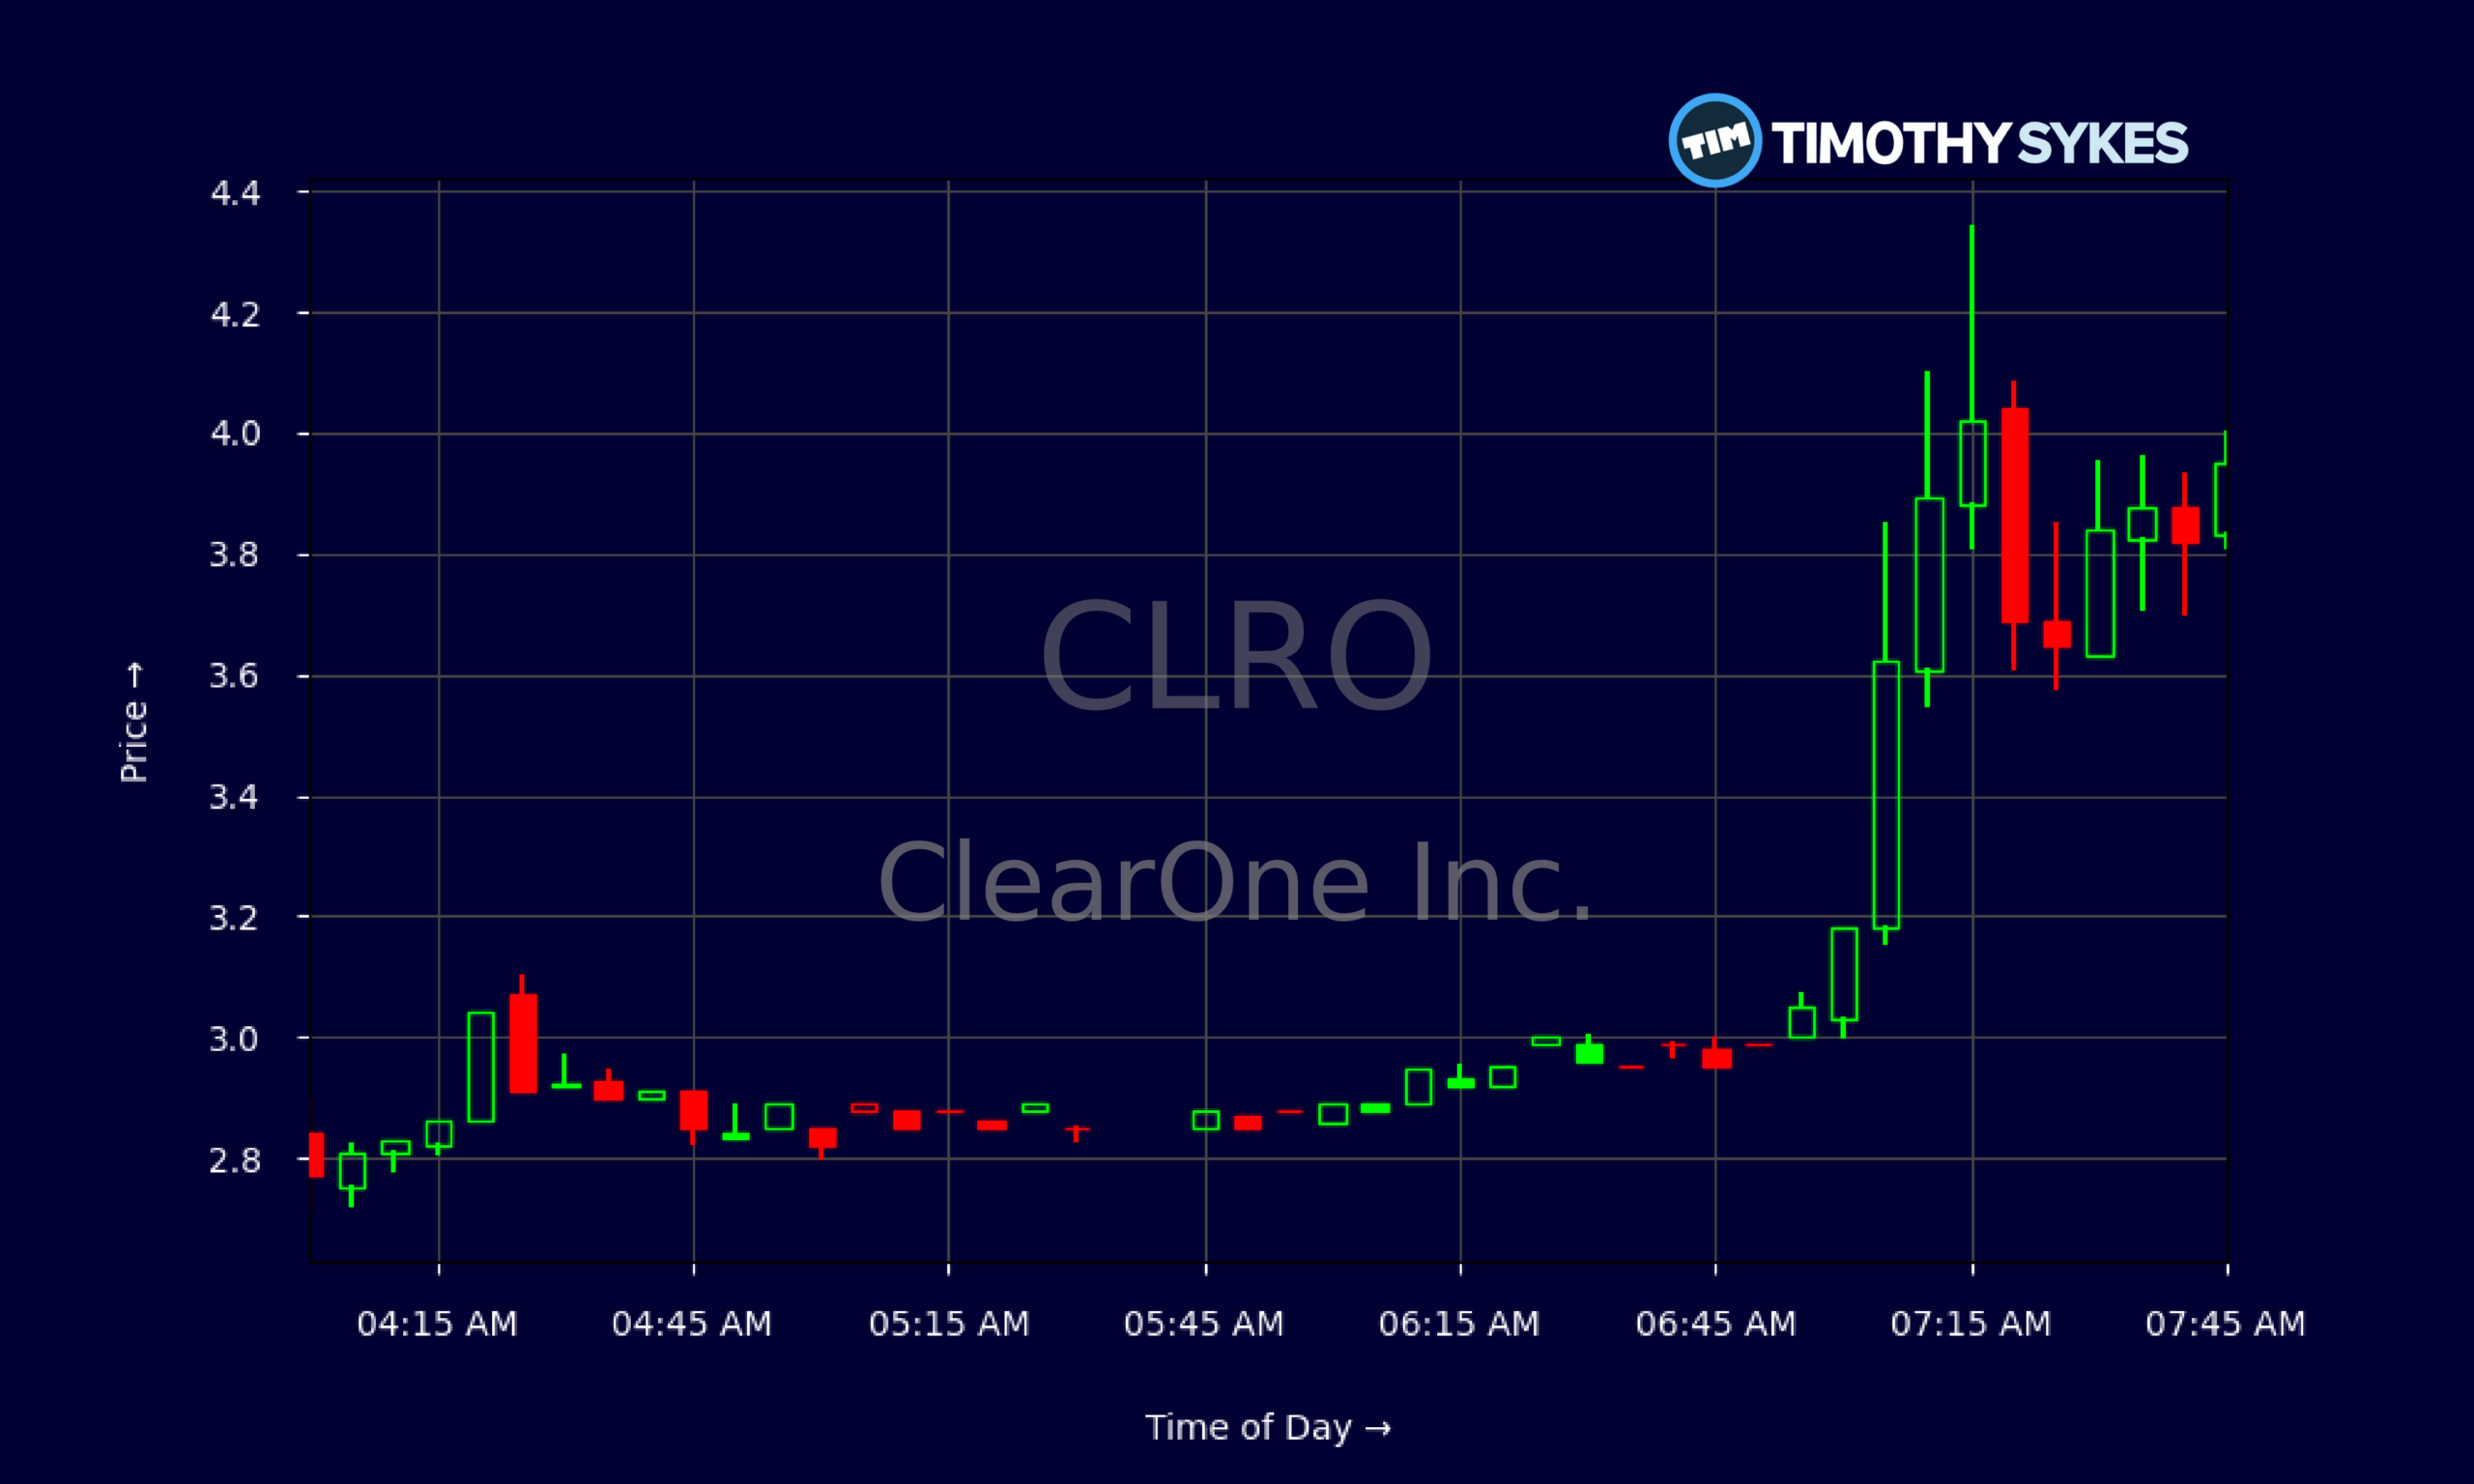
Live Update At 07:49:09 EDT: On Monday, October 26, 2026 ClearOne Inc. stock [NASDAQ: CLRO] is trending up by 21.85%! Discover the key drivers behind this movement as well as our expert analysis in the detailed breakdown below.
Quick Financial Overview
ClearOne Inc., trading under ticker CLRO, is acting like a classic penny‑stock battleground. The fundamentals tell a rough story. In the latest quarter ending 2026/06/30, ClearOne Inc. posted a net loss of about $914,000, or roughly -$0.34 per share. EBITDA and operating income were both negative, pointing to a business still struggling to cover basic costs.
Revenue was so weak that gross profit printed slightly negative, with cost of revenue around $70,000 and operating expenses near $849,000. That math explains why CLRO’s key profitability ratios look ugly, including deeply negative returns on assets and equity.
More Breaking News
On the cash side, CLRO burned about $172,000 of operating cash flow in the quarter and only finished with around $75,000 in cash, partly offset by $447,000 in restricted cash. To plug the hole, ClearOne Inc. issued $500,000 of short‑term debt, pushing total liabilities above $1.37M and leaving stockholders’ equity at roughly -$381,000. For traders, that mix of weak earnings, leverage, and small cash balance screams “high risk, high volatility” — exactly the kind of profile that can fuel big percentage swings in CLRO.
Why Traders Are Watching CLRO’s Wild Price Swings
Even with those shaky fundamentals, CLRO keeps attracting active trading. The chart explains why. On the daily timeline, ClearOne Inc. ripped from a $1.97 open to a $4.685 high and closed at $3.25 on the most recent session in the dataset. Just a few days earlier, CLRO closed at $5.00 after touching $5.31. That’s a massive boom‑and‑bust pattern in a very short window.
The pullback from $5.00 to the $1.72–$1.92 range shows traders locking in gains fast and late buyers getting trapped. For momentum traders, CLRO is the kind of name you stalk, not marry. You let the chart tell you when the crowd is piling in again.
Intraday, the 5‑minute data paints the same picture. CLRO opened the premarket around $2.75–$2.90, then steadily pushed through $3.00, $3.50, and briefly over $4.00. Swings of $0.30–$0.50 in minutes mean ClearOne Inc. can reward tight, disciplined trading — but punish hesitation.
At the company level, negative equity and a current ratio near 1.1 show ClearOne Inc. has just enough working capital to grind forward, not cruise. The quick ratio of 0.1 says most current assets are tied up in inventory and other less liquid items. That fragility often amplifies every rumor, every chart break, and every spike in volume.
So traders watching CLRO are focused on levels, not long‑term plans. The key question: does support hold near the recent $1.70–$1.90 zone, allowing another squeeze toward $3.50–$4.00? Or do sellers crack that floor and send ClearOne Inc. back into a slow bleed?
Conclusion
CLRO sits at the crossroads of weak fundamentals and powerful price action. ClearOne Inc. is losing money, carrying more than $1.37M in liabilities against negative equity, and operating with a thin $75,000 cash cushion. That is not a stable base for long‑term confidence, but it is exactly the setup that often breeds sharp, emotion‑driven moves as traders react to every bounce and breakdown.
On the chart, CLRO has already shown how fast sentiment can flip — from a $5.00 close down to the low $2s and high $1s in just a handful of days. Intraday ranges over $1 per share on a low‑priced stock mean small accounts can see big percentage swings, for better or worse. ClearOne Inc. will stay on many watchlists as long as volume remains elevated and those wide intraday candles keep forming.
For traders who study CLRO, the edge comes from preparation, not prediction. Map the support and resistance zones. Track volume surges. Respect the risks laid out in the financials. As millionaire penny stock trader and teacher Tim Sykes, says, “Cut losses quickly, let profits ride, and don’t overtrade.”. As Tim Sykes loves to remind traders, “The market doesn’t care about your opinion, only your preparation and your rules. Cut losses quickly, or the market will do it for you.” CLRO is a live example of why that mindset matters. This analysis is for educational and research purposes only, not trading advice.
This is stock news, not investment advice. Timothy Sykes News delivers real-time stock market news focused on key catalysts driving short-term price movements. Our content is tailored for active traders and investors seeking to capitalize on rapid price fluctuations, particularly in volatile sectors like penny stocks. Readers come to us for detailed coverage on earnings reports, mergers, FDA approvals, new contracts, and unusual trading volumes that can trigger significant short-term price action. Some users utilize our news to explain sudden stock movements, while others rely on it for diligent research into potential investment opportunities.
Dive deeper into the world of trading with Timothy Sykes, renowned for his expertise in penny stocks. Explore his top picks and discover the strategies that have propelled him to success with these articles:
- Penny Stocks Trading Guide
- Best Penny Stocks Under $1 to Buy Today
- Top 8 Penny Stocks to Watch on Robinhood
Once you’ve got some stocks on watch, elevate your trading game with StocksToTrade the ultimate platform for traders. With specialized tools for swing and day trading, StocksToTrade will guide you through the market’s twists and turns.
Dig into StocksToTrade’s watchlists here:





Leave a reply