

AT&T Inc. stocks have been trading down by -6.16 percent amid heightened concern over network outages and service reliability.
Key Takeaways
- Shares of AT&T, Verizon, and T-Mobile dropped 10–13% after SpaceX agreed to acquire a nationwide low-band spectrum portfolio, raising fears of a disruptive Starlink Mobile challenger.
- Scotiabank cut its AT&T price target, warning SpaceX’s U.S. spectrum deal makes its hybrid satellite–terrestrial network a credible long-term competitive threat to major U.S. carriers.
- Bernstein downgraded AT&T from Outperform to Market Perform and trimmed its target to $24, citing mounting Starlink competition, pricing pressure, and seasonal Q4 headwinds.
- AT&T, Verizon, and T-Mobile were the three worst S&P 500 names after the Starlink Mobile spectrum move, with AT&T down roughly 10% and T-Mobile off 13%.
- Shares of AT&T, T-Mobile, and Verizon also sank 6–8% after hours when SpaceX first announced the 800 MHz spectrum agreement, seen as the missing piece for full U.S. phone coverage.
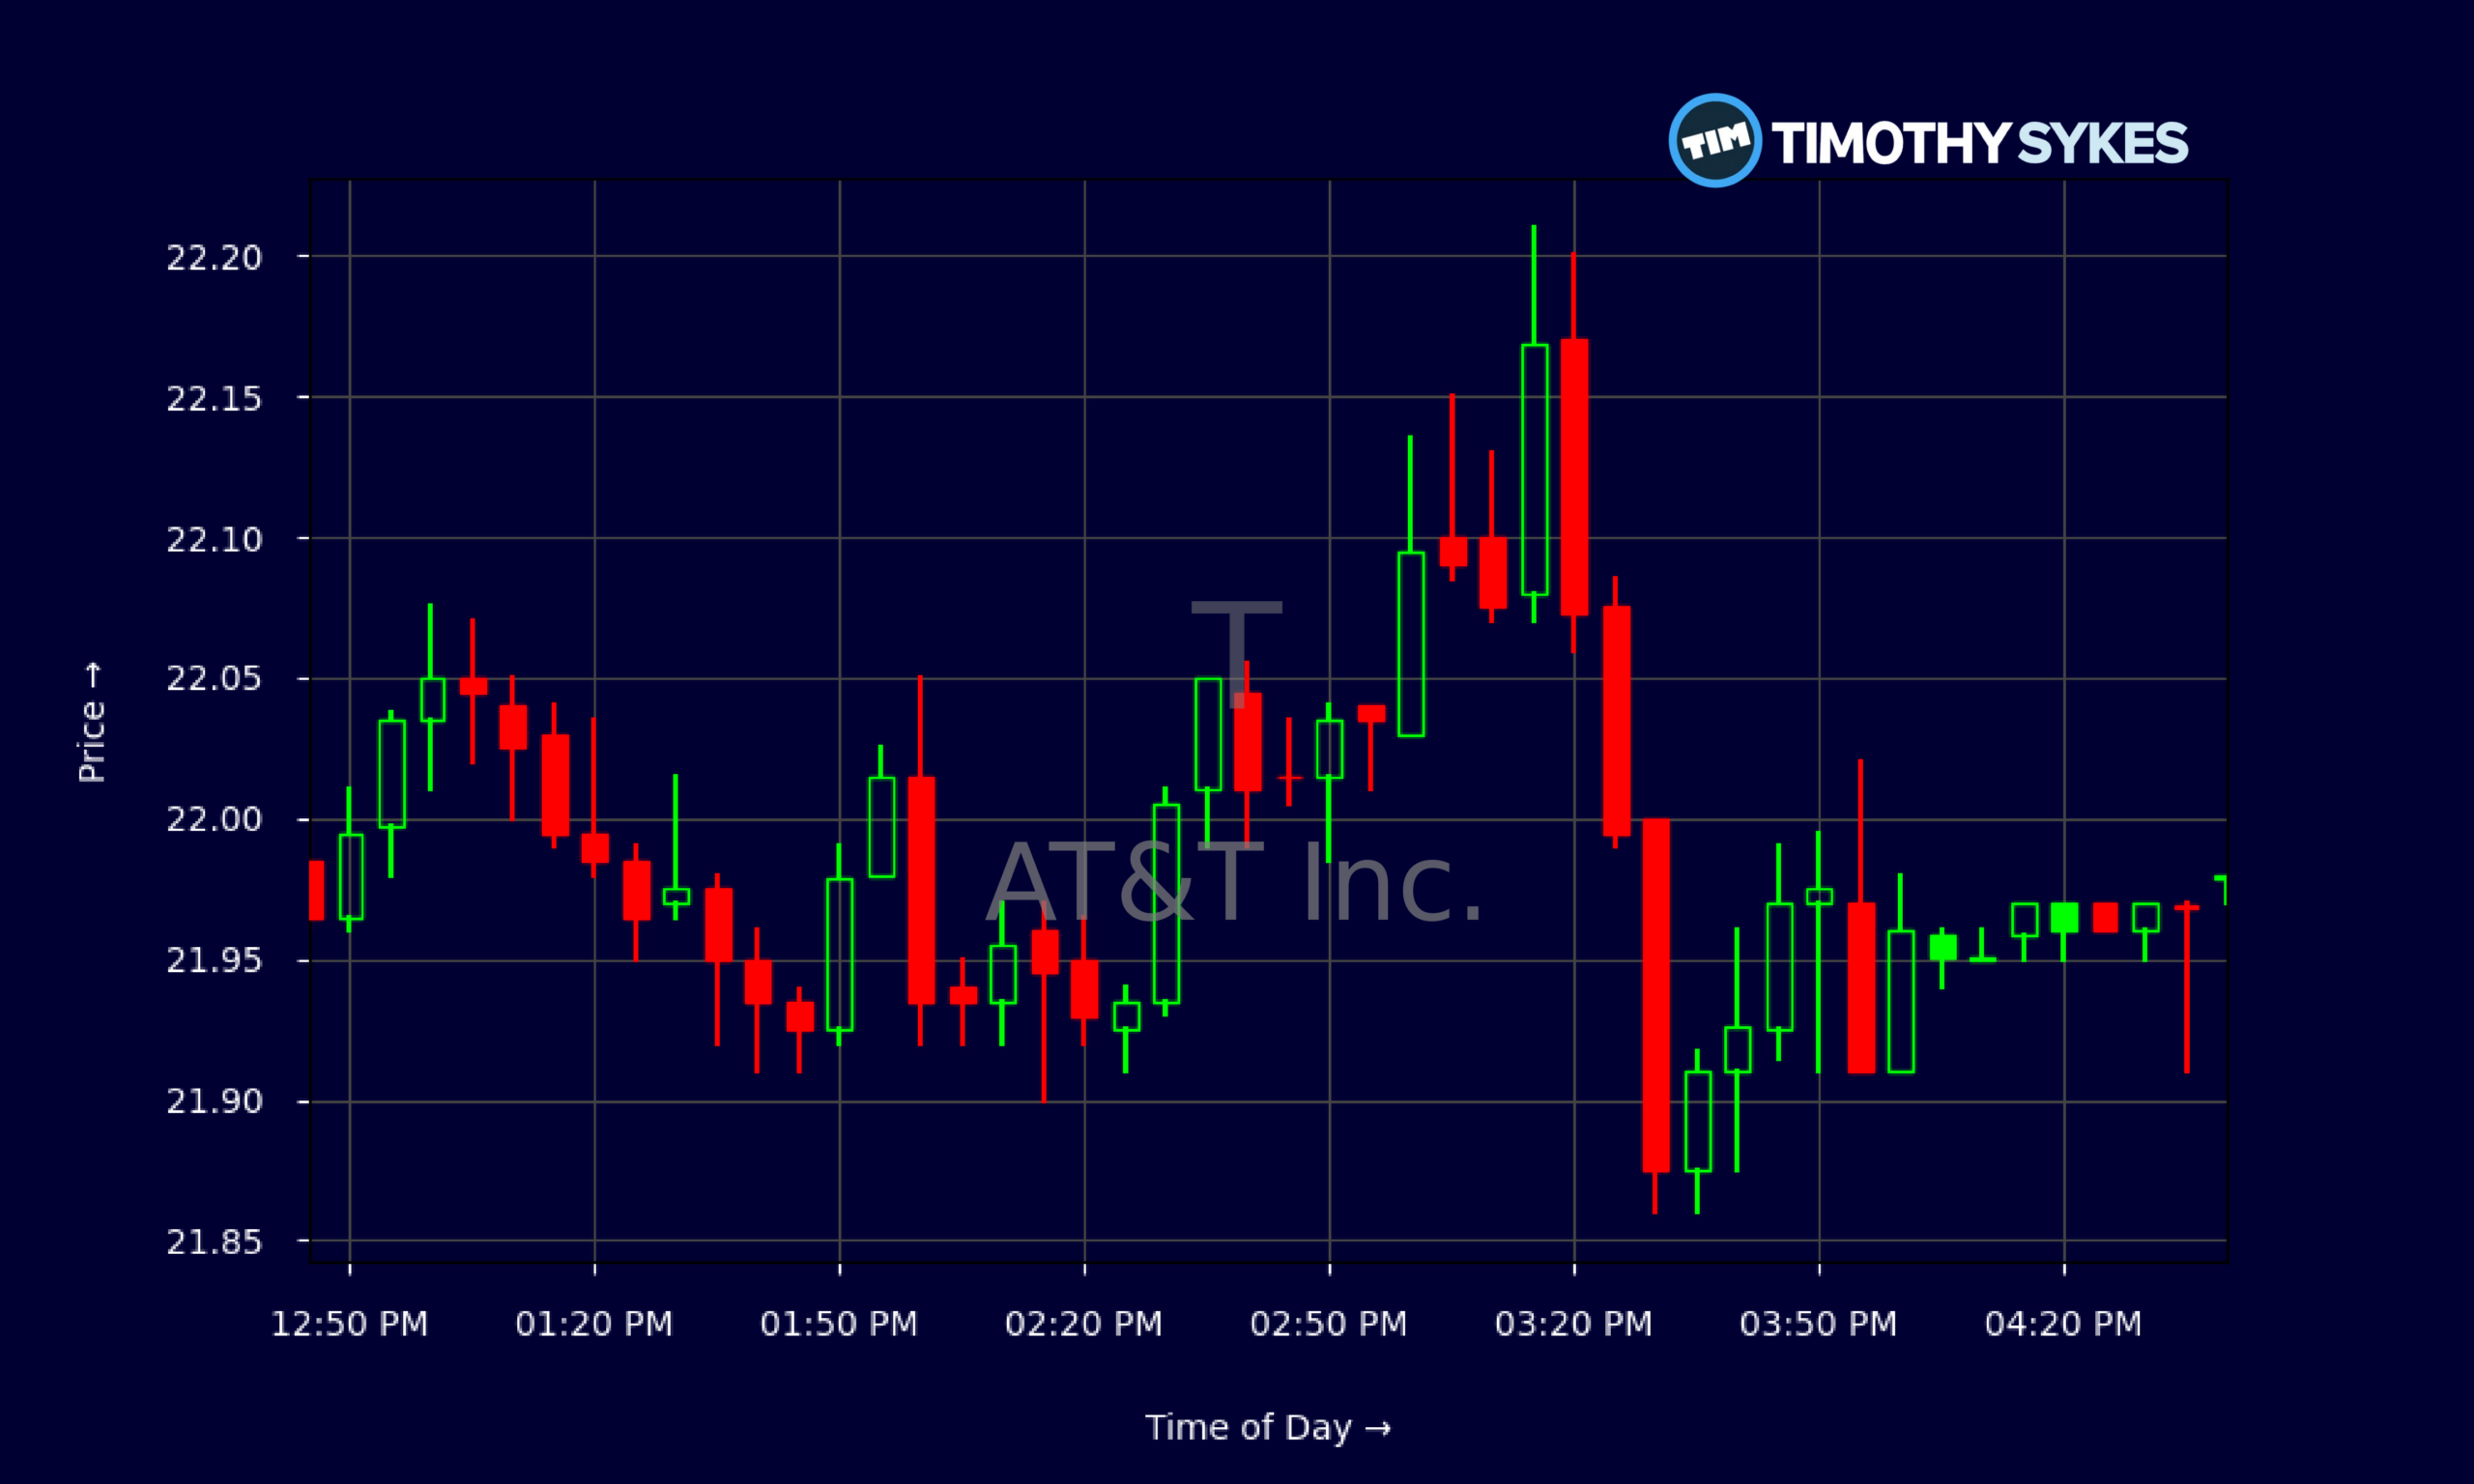
Live Update At 16:46:40 EDT: On Wednesday, October 21, 2026 AT&T Inc. stock [NYSE: T] is trending down by -6.16%! Discover the key drivers behind this movement as well as our expert analysis in the detailed breakdown below.
Quick Financial Overview
AT&T Inc. (T) is taking a hit on the chart, but the financial engine underneath still throws off real cash. Over the past few weeks, T has fallen from about $25 on 2026/09/28 to roughly $21.91 on 2026/10/21. That’s a slide of more than 12%, wiping out months of slow grind higher. For short-term traders, this is a clear trend break and a reminder that headline risk trumps steady fundamentals in the near term.
Fundamentally, AT&T generated about $31.56B in quarterly revenue and $7.32B in operating income. Profit margins are solid, with EBIT margin above 26% and EBITDA margin over 40%. Free cash flow of roughly $5.17B in the latest quarter supports a sizable dividend near $1.11 per share annually, implying a yield around 4–5% at current T prices.
More Breaking News
Leverage is still heavy, with total debt-to-equity at 1.47 and long-term debt around $134B, so the balance sheet is not bulletproof. But interest coverage near 7.5 times gives AT&T room to manage its debt stack. With a P/E near 7.4 and price-to-cash-flow under 4, T screens cheap on traditional metrics — yet traders are clearly assigning a discount for rising competitive risk and slow top-line growth.
Why Traders Are Watching AT&T After The Starlink Shock
For AT&T, this Starlink Mobile headline is not just noise — it’s a direct hit to the core story the street has been leaning on: stable cash cow, steady dividend, sleepy stock. When SpaceX agreed to acquire a nationwide 800 MHz low-band spectrum portfolio, the market suddenly treated AT&T, Verizon, and T-Mobile like broken stories. Shares of AT&T dropped roughly 10%, while T-Mobile plunged about 13%, making all three the worst performers in the S&P 500 on that session.
The message from traders was simple: the competitive game board just changed. Low-band spectrum plus satellites means Starlink Mobile can realistically challenge AT&T’s coverage edge in weak-signal and rural areas — the very spots where AT&T has long marketed reliability. After-hours trading saw AT&T slide 6–8% as the spectrum news hit. The selling then rolled right into premarket, with telecom carriers trading sharply lower again as the reality set in that this is not a one-day story.
Analysts are confirming that shift. Scotiabank cut its AT&T price target and openly framed SpaceX’s hybrid satellite–terrestrial network as a credible long-term threat. Bernstein went further for traders focused on T: it downgraded AT&T from Outperform to Market Perform and trimmed the target to $24, pointing to Starlink pressure, price wars in broadband and wireless, and seasonal Q4 headwinds.
For active traders, that combination — structural fear plus fresh downgrades — tends to cap bounces and create “sell-the-rip” setups in AT&T until a new equilibrium is found.
Conclusion
Right now AT&T sits at the crossroads of solid financials and shaken confidence. On one side, T still prints over $10.8B in quarterly operating cash flow, spends about $5.7B on capital expenditure, and comes out the other end with more than $5B in free cash flow. That supports the dividend, keeps bondholders calm, and gives management tools to respond to Starlink Mobile. On paper, the income statement and cash flow statement for AT&T still look like those of a mature, durable telecom franchise.
On the other side, the chart tells a very different story. AT&T has broken down from the mid-$24s to the low-$22s and then sub-$22, with intraday action full of failed bounces as traders use strength to exit. With T, Verizon, and T-Mobile all hammered on the Starlink spectrum deal, the whole sector is trading like the old rules no longer apply. Analyst downgrades from Scotiabank and Bernstein add another layer, signaling that even the bulls are stepping back, at least for now.
For traders, this is textbook disruption risk colliding with a high-yield, “safe” name. That’s where emotional selling and opportunity often live side by side. As Tim Sykes likes to say, “Volatility is where disciplined traders separate themselves — you don’t predict, you react, you cut losses fast, and you let the chart prove itself.” As millionaire penny stock trader and teacher Tim Sykes, says, “It’s not about how much money you make; it’s about how much money you keep.” In a choppy tape like this, that mindset matters just as much as any chart pattern, especially for traders trying to protect their accounts during fast-moving headlines. With AT&T, the task now is simple: respect the new downtrend, study how T trades around these headlines, and wait for clean setups instead of clinging to old narratives. This article is for educational and research purposes only and is not investment advice.
This is stock news, not investment advice. Timothy Sykes News delivers real-time stock market news focused on key catalysts driving short-term price movements. Our content is tailored for active traders and investors seeking to capitalize on rapid price fluctuations, particularly in volatile sectors like penny stocks. Readers come to us for detailed coverage on earnings reports, mergers, FDA approvals, new contracts, and unusual trading volumes that can trigger significant short-term price action. Some users utilize our news to explain sudden stock movements, while others rely on it for diligent research into potential investment opportunities.
Dive deeper into the world of trading with Timothy Sykes, renowned for his expertise in penny stocks. Explore his top picks and discover the strategies that have propelled him to success with these articles:
- Penny Stocks Trading Guide
- Best Penny Stocks Under $1 to Buy Today
- Top 8 Penny Stocks to Watch on Robinhood
Once you’ve got some stocks on watch, elevate your trading game with StocksToTrade the ultimate platform for traders. With specialized tools for swing and day trading, StocksToTrade will guide you through the market’s twists and turns.
Dig into StocksToTrade’s watchlists here:





Leave a reply