

Inventiva S.A. jumps as positive clinical and partnership news fuel investor optimism; stocks have been trading up by 11.35 percent
Key Takeaways
- Street price targets on IVA have been raised, with multiple Buy ratings signaling growing confidence in lanifibranor’s late‑stage path.
- Canaccord now sees IVA at $21, tying its call to Phase III NATiV3 data due in Q4, an NDA push in 2027, and a possible 2028 launch.
- Truist boosted its IVA target to $18 after dissecting Phase 2b NATIVE data and Phase 3 powering, arguing key MASH endpoints look achievable with manageable side effects.
- Current IVA analyst consensus is Buy with a mean target of $15.75, suggesting upside from recent trading levels around the mid‑$3 area.
- H1 showed a much smaller per‑share loss but zero revenue, while IVA prepares fresh lanifibranor poster data for AASLD 2026, backing its pan‑PPAR story in MASH/MASLD.
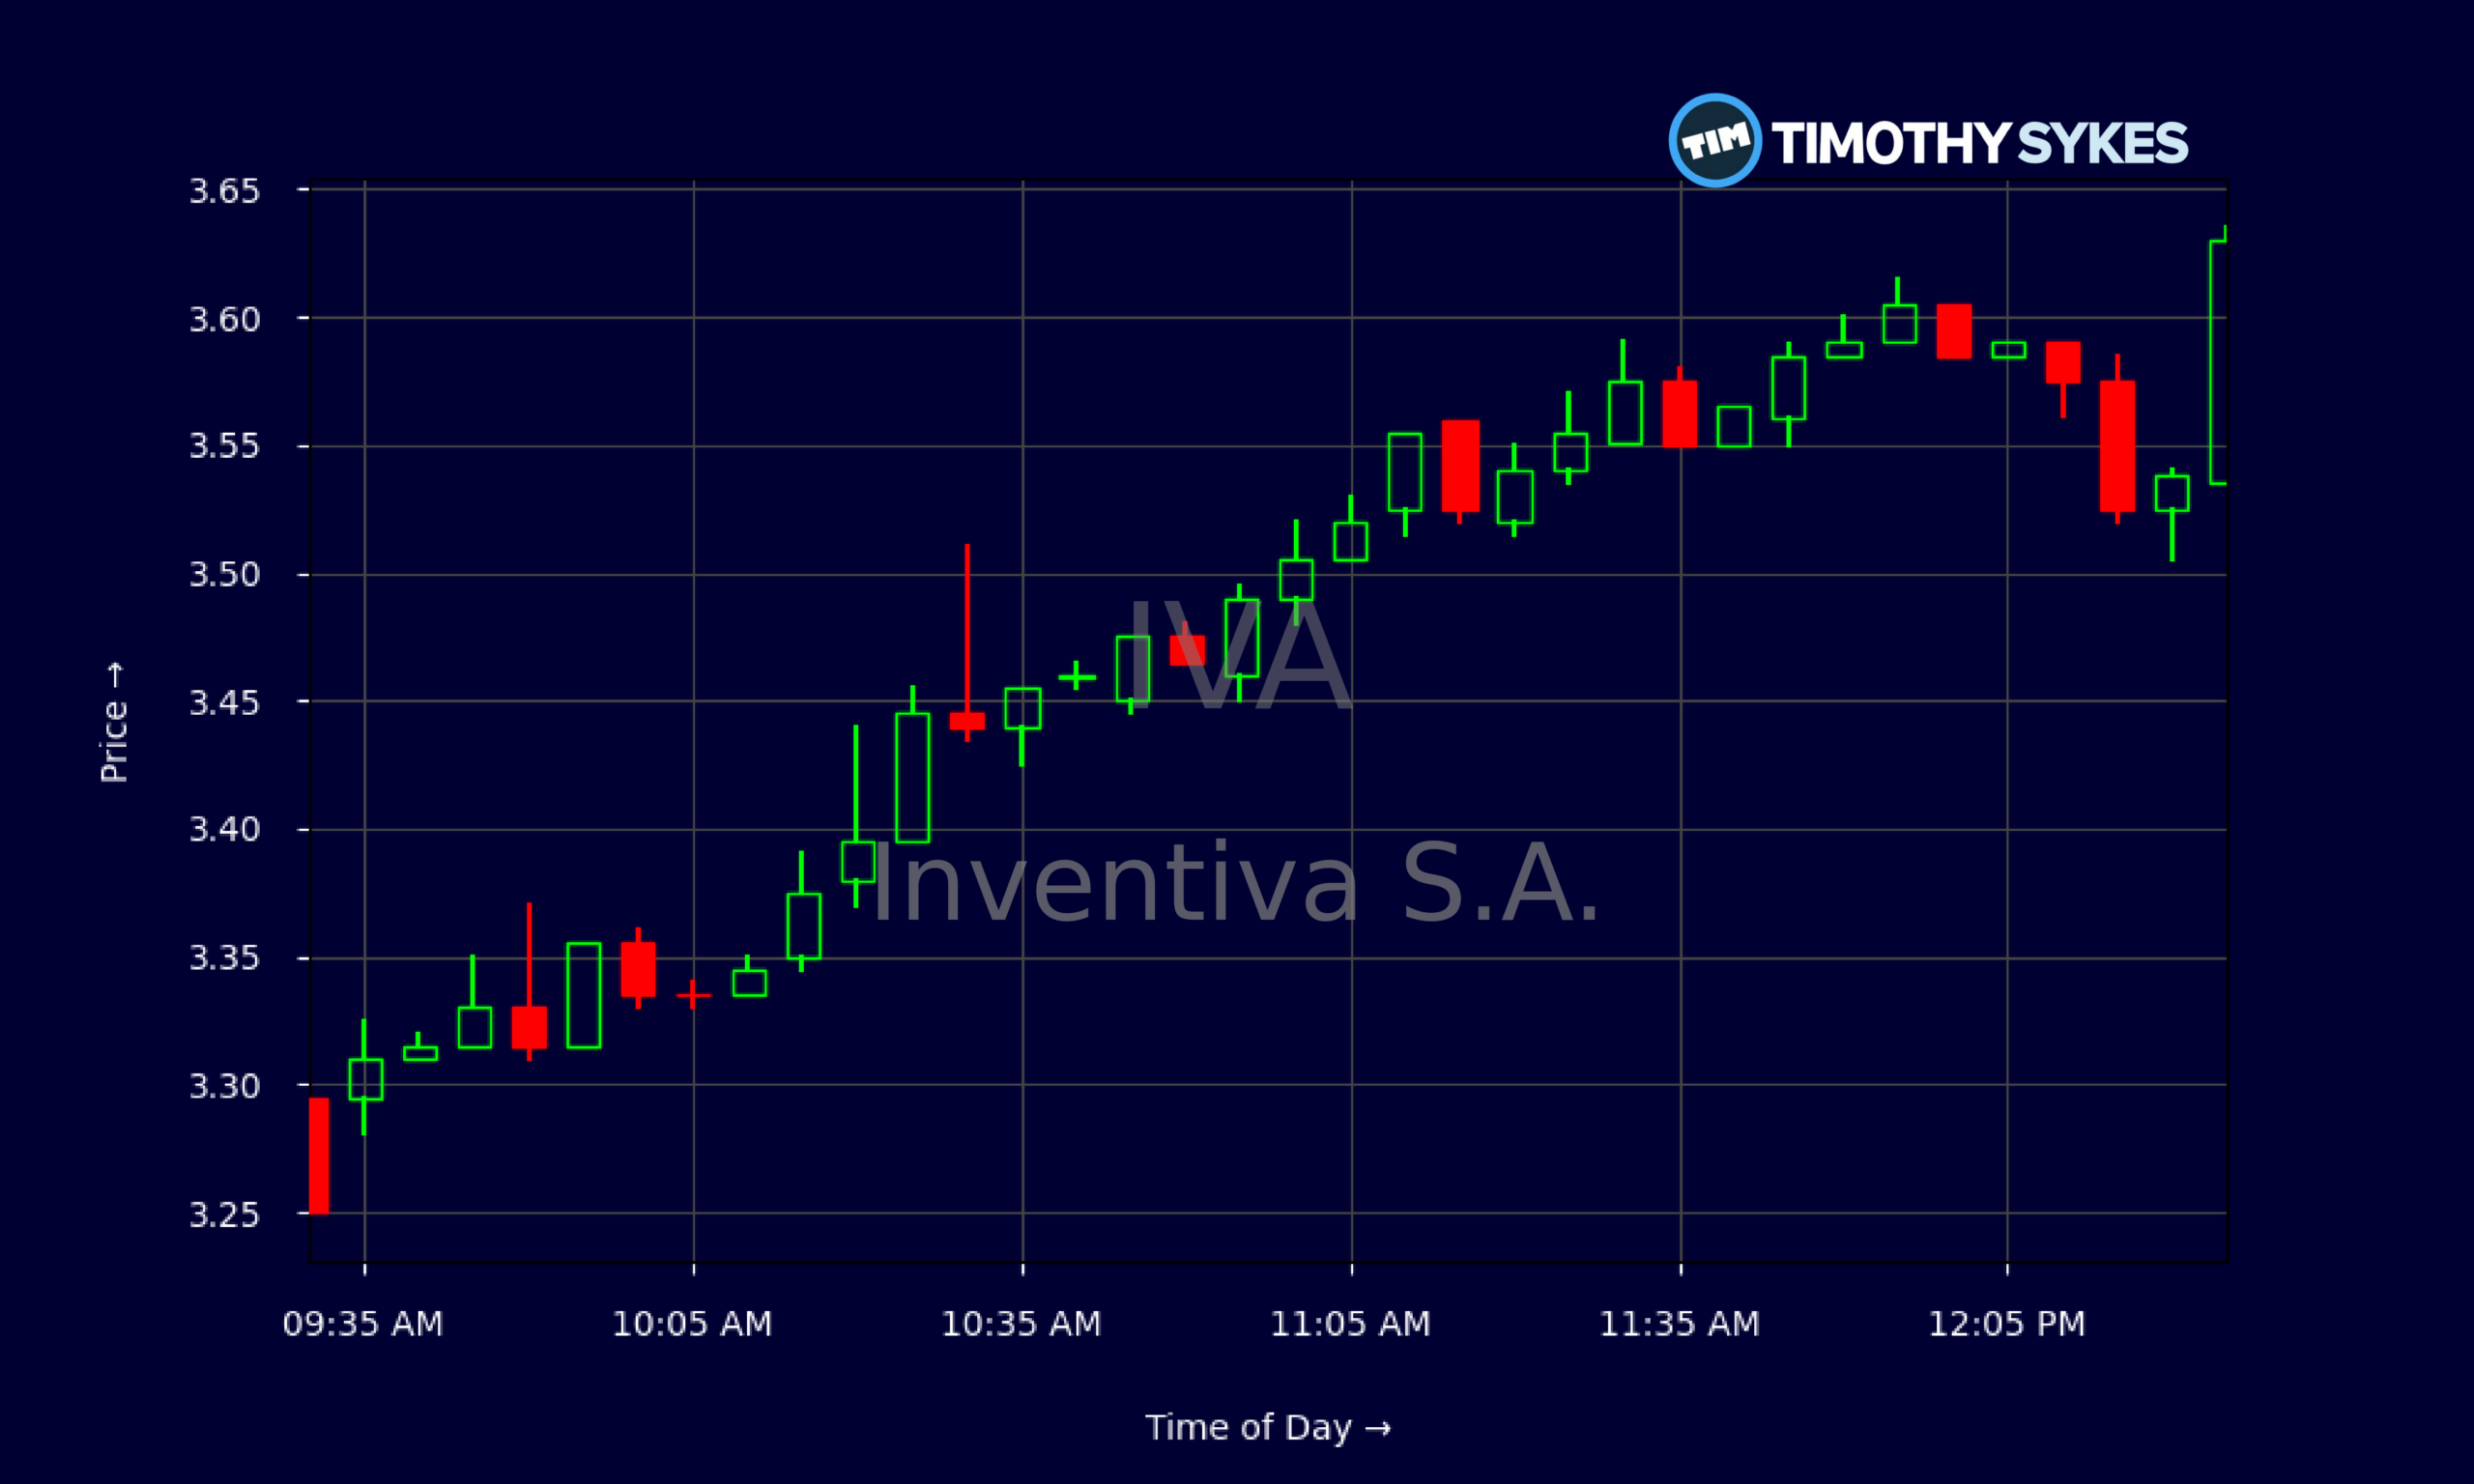
Live Update At 12:32:16 EDT: On Wednesday, October 21, 2026 Inventiva S.A. stock [NASDAQ: IVA] is trending up by 11.35%! Discover the key drivers behind this movement as well as our expert analysis in the detailed breakdown below.
Quick Financial Overview
IVA is still a classic pre‑commercial biotech chart, but traders are starting to see signs of tightening fundamentals. The company’s latest half‑year report showed a sharply narrowed net loss per share of EUR -0.25, versus EUR -1.62 a year earlier. That is a big step toward better cost control, even though IVA recorded no revenue compared with EUR 4.5M in the prior period. The market initially pushed IVA down about 2.8% premarket on that update, reminding everyone this ticker remains dependent on future milestones, not current sales.
More Breaking News
On the balance sheet, IVA is sitting on roughly $231M in cash and short‑term investments against about $27M of long‑term debt and a similar level of current borrowings. For traders, that cash runway is key; it shapes how long IVA can push lanifibranor through Phase III and regulatory work without needing to tap capital markets aggressively. On the chart, IVA has bounced from the high‑$2s to the mid‑$3s in recent days, with the latest close near $3.63 after a steady intraday grind higher, signaling quiet accumulation rather than wild speculation.
Why Traders Are Watching IVA Into Q4
IVA has turned into a slow‑burn biotech story that suddenly has a calendar full of catalysts. The centerpiece is lanifibranor, its lead drug for MASH/MASLD. Phase III NATiV3 topline data are expected in Q4, and that timing is driving a lot of the current trading interest. Canaccord’s move to lift its IVA price target to $21, while keeping a Buy rating, tells you the Street is mapping out a full timeline: Q4 data, an NDA filing in 2027/01, and a potential commercial launch in 2028. For swing traders, that creates a defined roadmap of news pockets.
Truist adds more fuel to the story. The bank raised its IVA target to $18 from $13 after digging deep into Phase 2b NATIVE data and the assumptions behind Phase 3 powering. That matters. It means the bullish stance is grounded in clinical statistics, not just hype. Truist believes the Phase 3 study is set up to hit key MASH endpoints with side effects the market can live with.
On top of that, IVA plans to present three new scientific posters on lanifibranor at AASLD The Liver Meeting 2026. These posters aim to strengthen the biological case for its balanced pan‑PPAR mechanism, showing activity across liver cell types, fibrosis pathways, and vascular function. Add in FDA Breakthrough Therapy and Fast Track tags for lanifibranor, and IVA starts to look like one of the higher‑conviction MASH trades heading into a pivotal readout. Still, traders know one thing: in biotech, data is destiny. Until NATiV3 reads out, every move is speculation around that binary event.
Conclusion
For active traders, IVA is that classic biotech setup where sentiment, science, and the chart are finally lining up. Analyst consensus on IVA now sits at Buy, with a mean target of $15.75 versus a recent price near $3.63. Canaccord’s $21 target and Truist’s $18 target both point to the same message: the Street sees meaningful upside if lanifibranor delivers in Phase III. At the same time, IVA’s tightened losses and strong cash pile give the company room to execute, even with no current product revenue.
Yet this is not a layup. IVA remains a pre‑commercial name with a negative equity position and a high price‑to‑sales ratio simply because there is almost no sales base to anchor valuation. Everything rides on lanifibranor and the NATiV3 data. That’s why the upcoming AASLD posters and Q4 topline readout are so important for IVA traders mapping risk versus reward.
As Tim Sykes likes to hammer home, “Trade the catalyst, not the hype.” As millionaire penny stock trader and teacher Tim Sykes, says, “Cut losses quickly, let profits ride, and don’t overtrade.”. IVA offers a clear catalyst path, but the only rational way to approach a name like this is with a trading plan, strict risk limits, and the mindset to cut losses fast if the story breaks.
This is stock news, not investment advice. Timothy Sykes News delivers real-time stock market news focused on key catalysts driving short-term price movements. Our content is tailored for active traders and investors seeking to capitalize on rapid price fluctuations, particularly in volatile sectors like penny stocks. Readers come to us for detailed coverage on earnings reports, mergers, FDA approvals, new contracts, and unusual trading volumes that can trigger significant short-term price action. Some users utilize our news to explain sudden stock movements, while others rely on it for diligent research into potential investment opportunities.
Dive deeper into the world of trading with Timothy Sykes, renowned for his expertise in penny stocks. Explore his top picks and discover the strategies that have propelled him to success with these articles:
- Penny Stocks Trading Guide
- Best Penny Stocks Under $1 to Buy Today
- Top 8 Penny Stocks to Watch on Robinhood
Once you’ve got some stocks on watch, elevate your trading game with StocksToTrade the ultimate platform for traders. With specialized tools for swing and day trading, StocksToTrade will guide you through the market’s twists and turns.
Dig into StocksToTrade’s watchlists here:





Leave a reply