

AstraZeneca PLC stocks have been trading up by 6.85 percent after promising clinical trial data fueled strong investor optimism.
What Traders Need To Know
- Phase III DeLLphi-305 data showed IMFINZI plus Amgen’s tarlatamab cut the risk of death by 58% versus IMFINZI alone in extensive-stage small cell lung cancer, with median overall survival reaching 21.1 months.
- In the Phase III VOLGA trial, perioperative IMFINZI plus neoadjuvant enfortumab vedotin improved event-free and overall survival in muscle-invasive bladder cancer and already has FDA Priority Review.
- CLARITY-Gastric01 showed sonesitatug vedotin (Sone-Ve) reduced risk of death by 42–53% in advanced CLDN18.2-positive gastric/GEJ cancers, with potential reach to about 60% of these patients.
- Phase III SAFFRON data showed TAGRISSO plus savolitinib beat chemotherapy on progression-free and overall survival in MET-driven, EGFR-mutated NSCLC after TAGRISSO, with a US NDA filed.
- Q3 results beat expectations with core EPS of $2.79 and revenue of $16.21B, helped by 7% revenue growth, 14% EPS growth, and a wave of late-stage oncology wins.
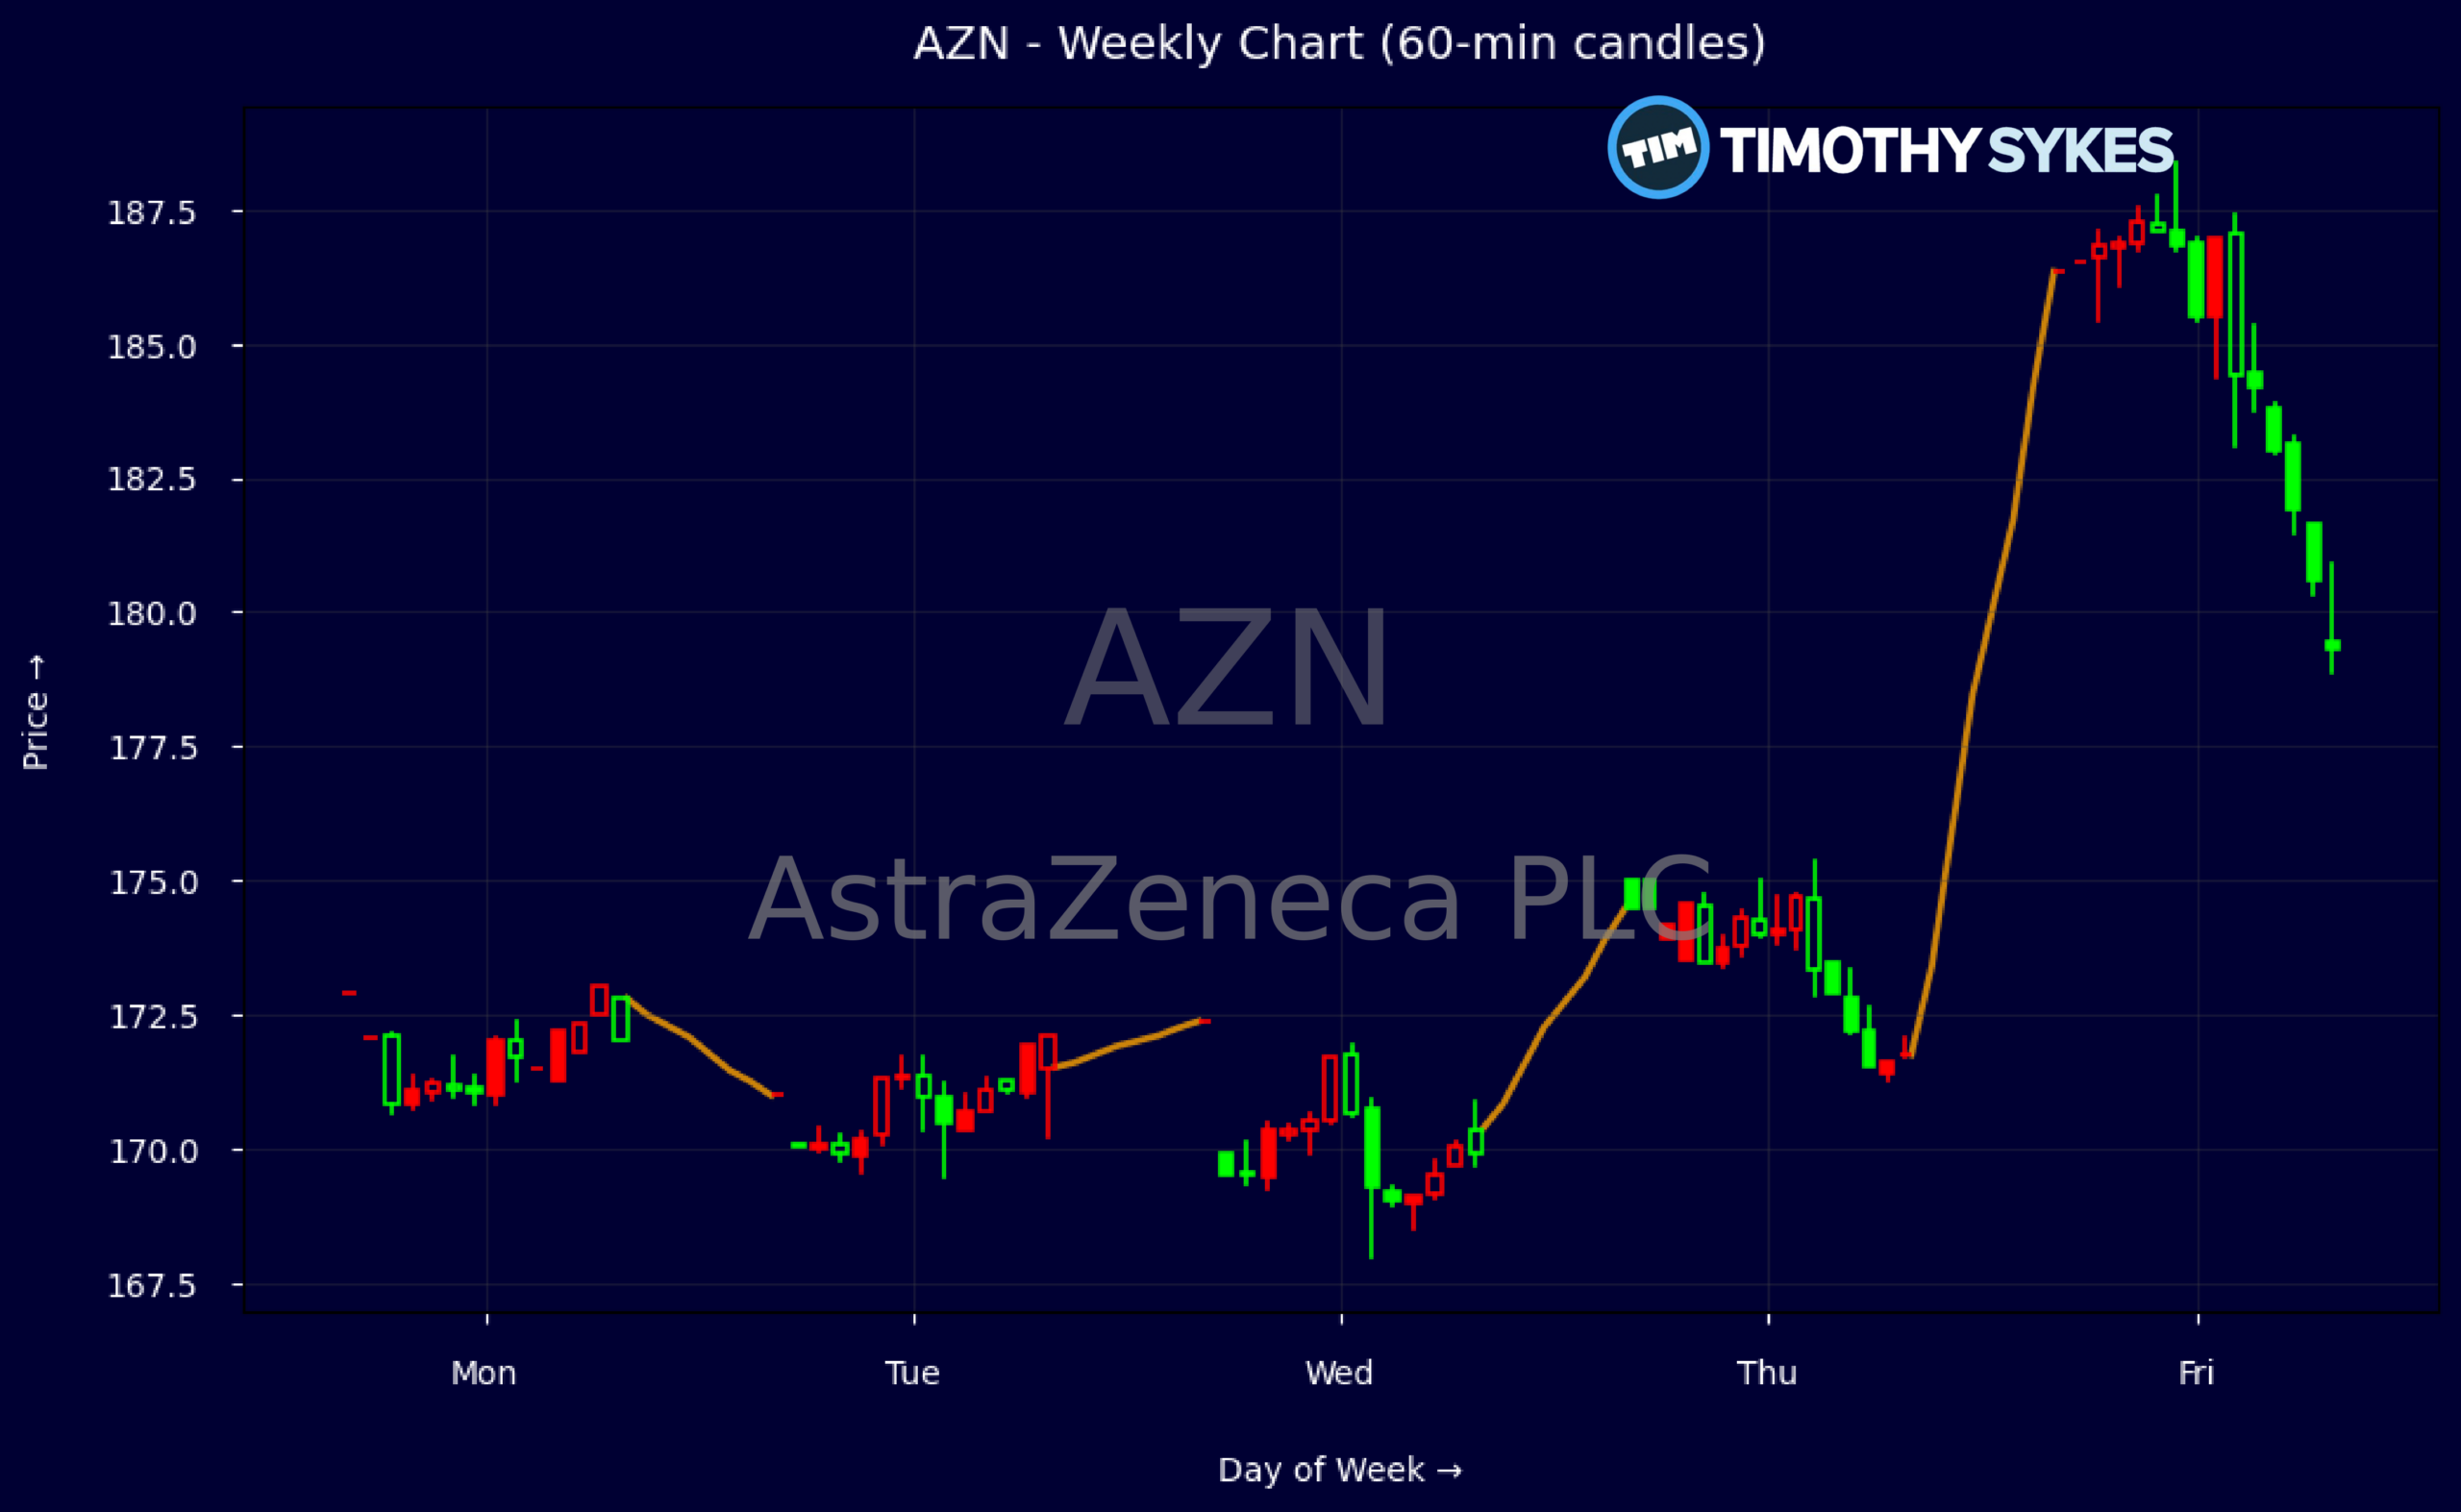
Weekly Update Oct 26 – Oct 30, 2026: On Sunday, November 01, 2026 AstraZeneca PLC stock [NYSE: AZN] is trending up by 6.85%! Discover the key drivers behind this movement as well as our expert analysis in the detailed breakdown below.
Healthcare industry expert:
Analyst sentiment – positive
AstraZeneca sits in the top tier of global large-cap pharma, with fundamentals consistent with a high-quality growth compounder. Revenue of ~$58.7B and 5‑year growth of ~30% underscore successful oncology and specialty launches, while EBIT and gross margins of 23.3% and 81.9% indicate strong pricing power and mix. Returns on equity near 22% and ROIC ~15–16% are well above sector averages. Leverage is moderate (D/E 0.64, interest coverage 11.9x), but liquidity (current ratio 0.9, quick 0.6) warrants monitoring. Valuation at ~24x earnings and ~4.1x sales prices in pipeline execution but remains reasonable versus premium oncology peers.
Technically, the weekly tape shows a sharp continuation breakout: shares have moved from ~172 to ~186 over five sessions, with successive higher highs and higher lows, confirming a strong bullish trend, likely supported by elevated post‑earnings and data‑driven volume. The key actionable level is the 174–176 zone, which aligns with the prior breakout area and now serves as primary support for adding risk on pullbacks. Near term, resistance sits near 190–192; sustained closes above that zone would open a path toward a higher trading range, while a weekly close back below 174 would signal momentum exhaustion and justify tighter risk controls.
Recent news flow is overwhelmingly positive versus broader healthcare and pharma benchmarks, with multiple Phase III wins across lung, bladder, gastric, and breast cancers, plus new Enhertu and ZEGFROVY indications, reinforcing AstraZeneca’s position as one of the sector’s most productive oncology platforms. Combined with a Q3 beat and reaffirmed mid‑ to high‑single‑digit revenue and low‑double‑digit EPS growth outlook, risk‑reward justifies a constructive stance. I see fair value 12‑month upside toward the low‑ to mid‑200s, with strong support around 174 and intermediate resistance near 190–192.
More Breaking News
Quick Financial Overview
AstraZeneca PLC (AZN) is pairing strong clinical news with solid numbers. Q3 revenue of $16.21B came in ahead of the $16B bar, with core EPS at $2.79 and double-digit earnings growth. Full-year guidance points to mid-to-high single-digit revenue growth and low double-digit EPS growth through 2026, which traders should read as a steady, not hyper-growth, story anchored in oncology. Margins are healthy, with an EBIT margin of 23.3% and gross margin near 81.9%, supporting premium valuation metrics.
The valuation is not cheap. AZN trades at about 24.3 times earnings and a price-to-sales around 4.1, with price-to-book near 5.0 and price-to-free-cash around 55.5. That tells you the market is paying up for the pipeline and oncology leadership. Returns on equity near 22% and return on capital in the mid-teens back up that premium, but leverage and liquidity need monitoring: total debt-to-equity is 0.64 and the current ratio sits at 0.9.
Price action confirms the positive shift. On the weekly tape, AZN pushed from the low $170s to a high above $187 into 2026/10/30, closing that day around $186.35 after a strong earnings reaction that saw shares jump more than 6% in one session. Intraday, a 5-minute bar showed a wide range from roughly $183 to $188 with a close near $186.65, signaling aggressive buying on dips and momentum follow-through. For short-term traders, that kind of expansion in range after a catalyst often marks the start of a new trading band rather than a one-off spike.
Conclusion
This is stock news, not investment advice. Timothy Sykes News delivers real-time stock market news focused on key catalysts driving short-term price movements. Our content is tailored for active traders and investors seeking to capitalize on rapid price fluctuations, particularly in volatile sectors like penny stocks. Readers come to us for detailed coverage on earnings reports, mergers, FDA approvals, new contracts, and unusual trading volumes that can trigger significant short-term price action. Some users utilize our news to explain sudden stock movements, while others rely on it for diligent research into potential investment opportunities.
Dive deeper into the world of trading with Timothy Sykes, renowned for his expertise in penny stocks. Explore his top picks and discover the strategies that have propelled him to success with these articles:
- Penny Stocks Trading Guide
- Best Penny Stocks Under $1 to Buy Today
- Top 8 Penny Stocks to Watch on Robinhood
Once you’ve got some stocks on watch, elevate your trading game with StocksToTrade the ultimate platform for traders. With specialized tools for swing and day trading, StocksToTrade will guide you through the market’s twists and turns.
Dig into StocksToTrade’s watchlists here:





Leave a reply