

T-Mobile US Inc. stocks have been trading up by 6.59 percent amid strong subscriber growth and network expansion optimism.
What Traders Need To Know
- Q3 2026 showed strong execution at T-Mobile US Inc., with rising postpaid ARPA, solid account growth, stronger EBITDA and free cash flow, plus higher full-year profitability and cash flow guidance alongside ongoing buybacks and dividends.
- EPS for Q3 landed at $3.22 versus $2.89 expected and $2.41 a year earlier, on revenue of $23.58B that also beat views and grew year over year, underscoring operating leverage.
- Deutsche Bank lifted its TMUS price target to $300 with a Buy rating, while Oppenheimer held at $260 Outperform, signaling solid upside potential from current levels in Street models.
- A broad group of firms, including TD Cowen, Scotiabank, JPMorgan, KeyBanc, Morgan Stanley and Freedom Broker, kept Buy/Outperform/Overweight calls, even as some trimmed targets on softer Q4 commentary and segment pressures.
- The new T-Mix tiered plan, with customizable “Picks” for perks like streaming, gaming, travel, and AI, is designed to enhance ARPU and retention, adding a fresh catalyst to the TMUS monetization story.
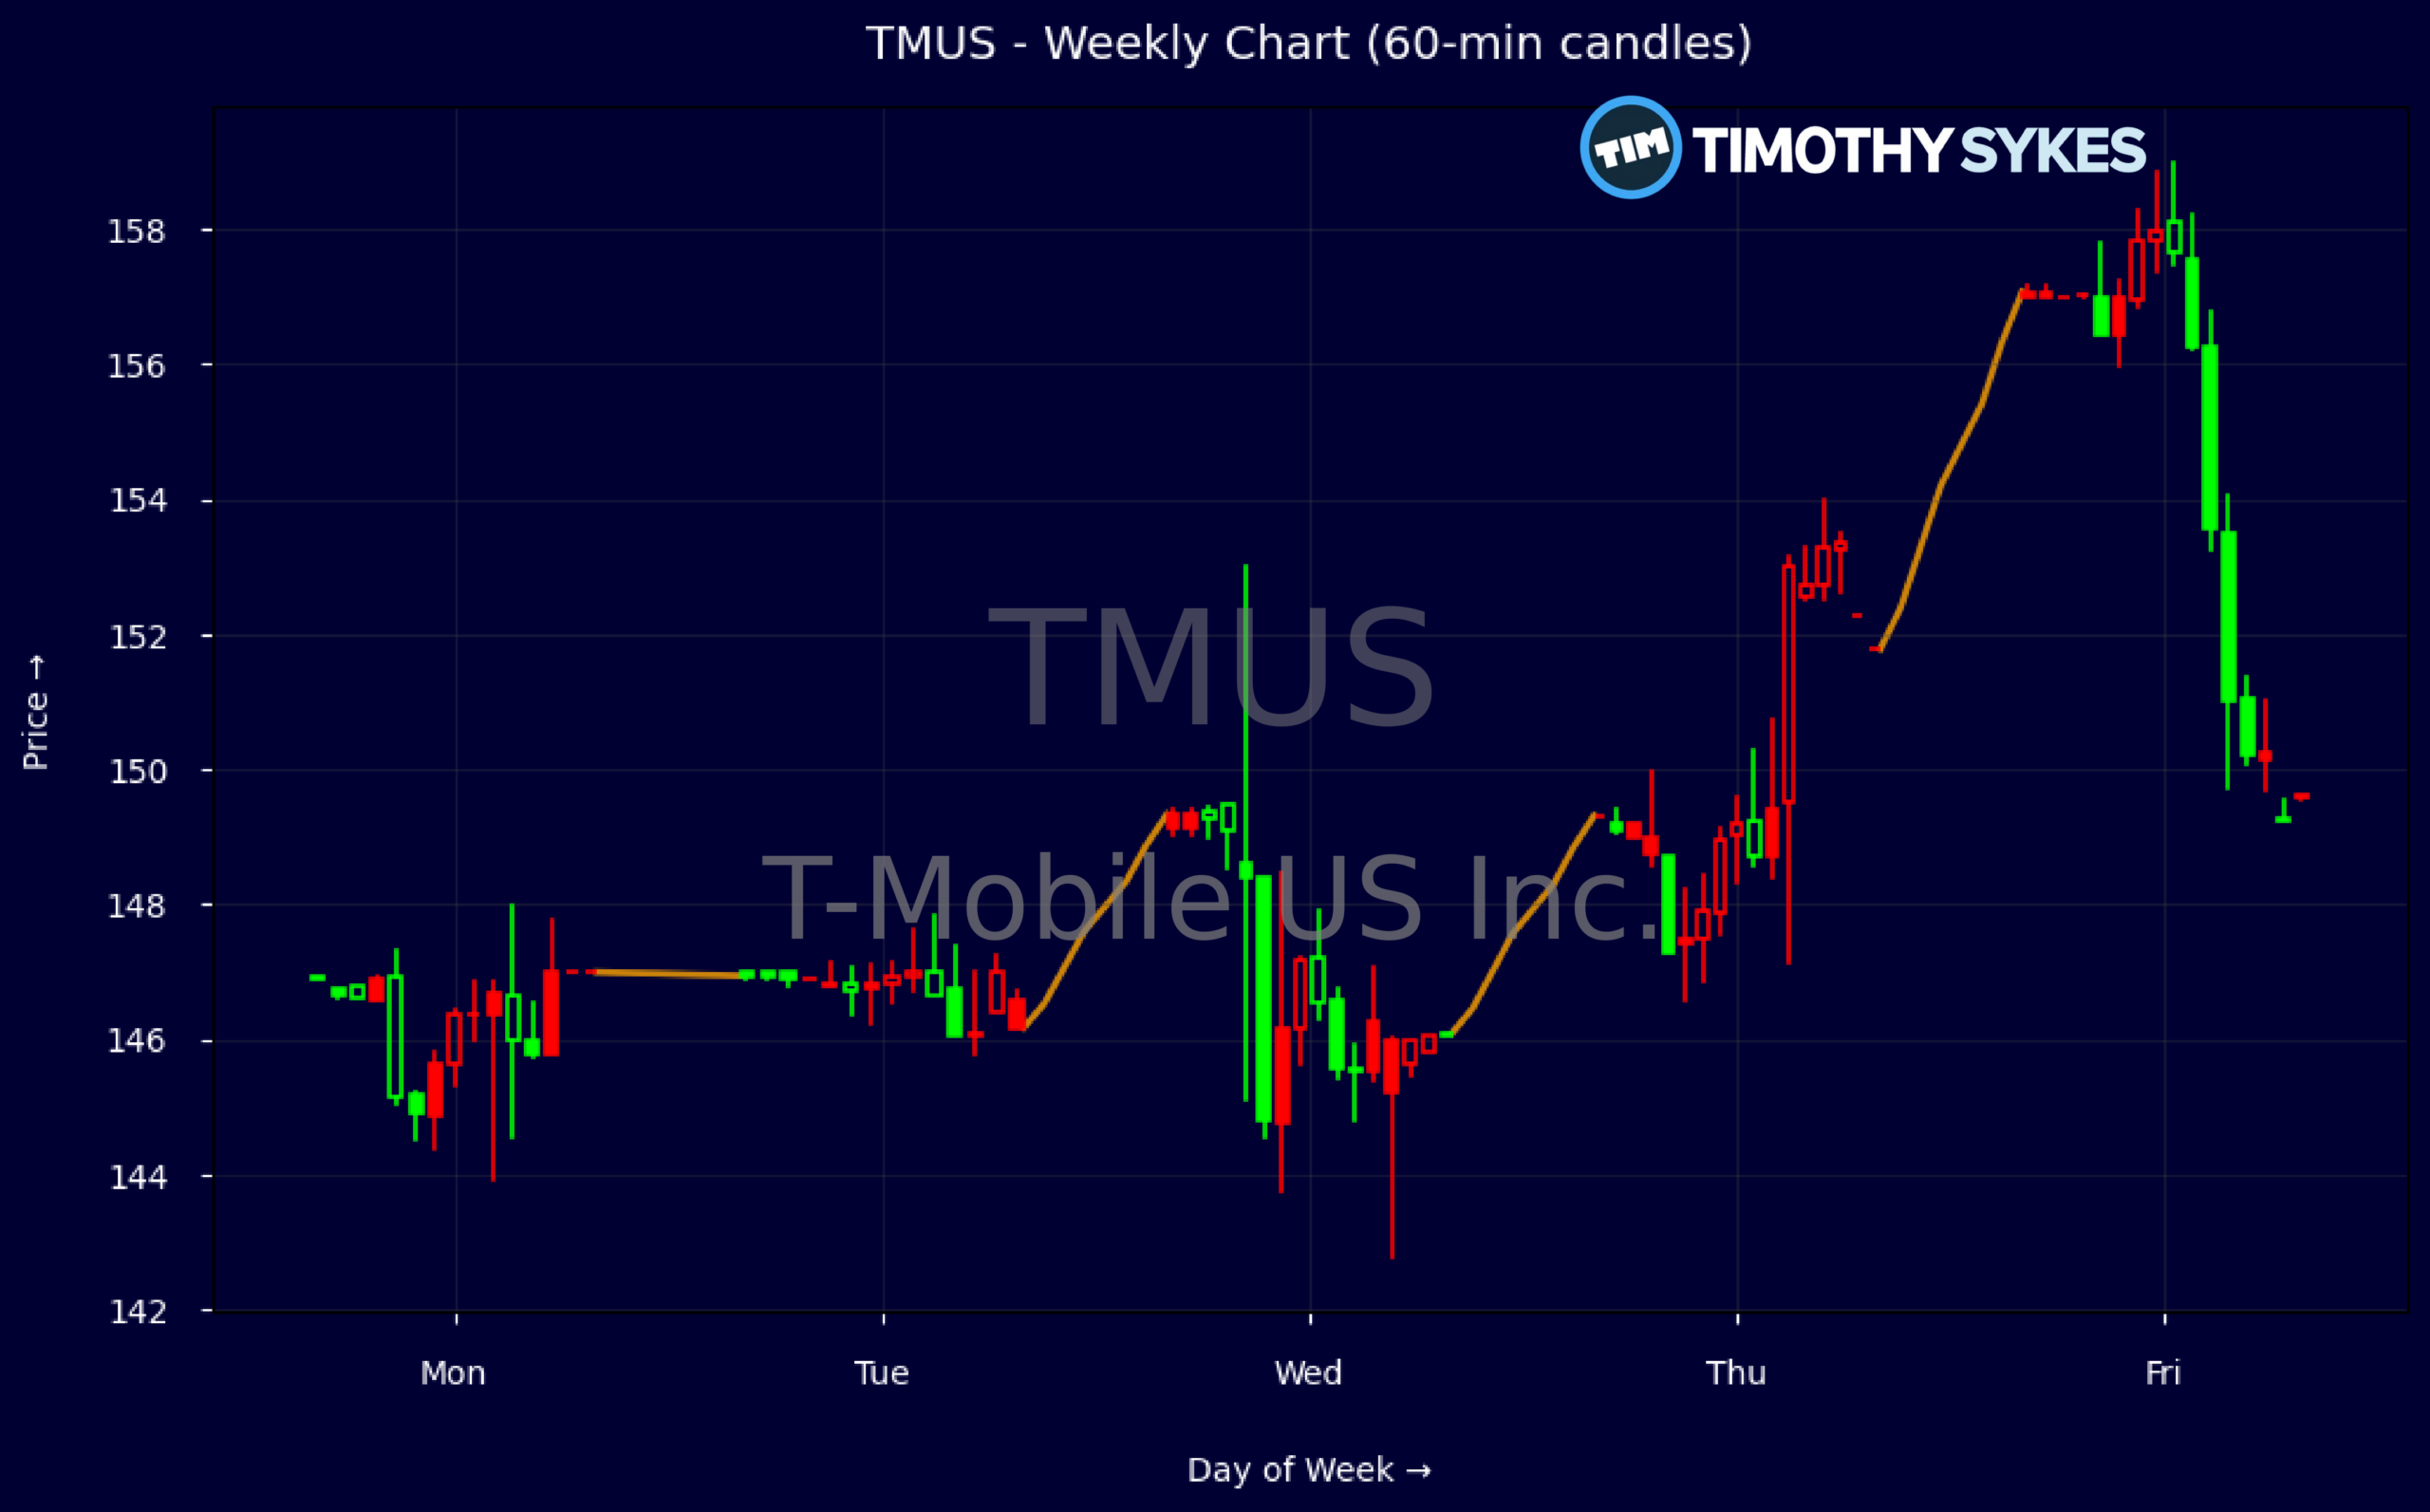
Weekly Update Oct 26 – Oct 30, 2026: On Sunday, November 01, 2026 T-Mobile US Inc. stock [NASDAQ: TMUS] is trending up by 6.59%! Discover the key drivers behind this movement as well as our expert analysis in the detailed breakdown below.
Media & Telecommunications industry expert:
Analyst sentiment – positive
T-Mobile’s fundamentals confirm its position as the premier US wireless pure play, with scale, network quality, and cash generation outpacing peers. A 62% gross margin, 35% EBITDA margin, and ~19% EBIT margin on ~$88B revenue support double‑digit ROE (~18%) despite leverage (total debt/equity 2.1x, interest coverage 8x). Free cash flow of ~$4.7B in Q3 and disciplined capex (~$2.6B reported) comfortably fund ~$2.99% dividend yield plus aggressive buybacks, while revenue growth (5.5% 3‑yr CAGR) and rising ARPA underpin durable mid‑teens EPS growth at ~15.5x P/E and only ~7.8x P/FCF, a clear discount to its quality.
Technically, TMUS is in a strong weekly uptrend: the stock jumped from ~$146 to ~$157, with the 10/30 bar printing a wide‑range bullish candle closing near the high, confirming institutional buying post‑earnings. Intraday 5‑minute action shows constructive consolidations rather than blow‑off spikes, suggesting healthy accumulation rather than exhaustion. The actionable level is $149–150, the breakout zone from the 10/28 session; above this, buyers remain in control, while a sustained break below would signal waning momentum and justify tight risk management for new longs.
Fundamental and news flow catalysts are uniformly favorable versus telecom and broader media/telecom benchmarks. Q3 beats on EPS and revenue, raised FCF guidance, and high‑quality net adds put TMUS ahead of Verizon/AT&T on growth, while initiatives like T‑Mix, first‑responder and community programs, and 5G positioning strengthen brand and pricing power. Street targets cluster around $200–230 with multiple Buys; I see fair value at $210 in 12–18 months, with support near $149 and resistance at $160 then $175.
More Breaking News
Quick Financial Overview
T-Mobile US Inc. just printed a clean beat quarter that matters for traders. Q3 EPS came in at $3.22, ahead of the $2.89 consensus and well above $2.41 a year ago, on revenue of $23.58B that also grew year over year. That lines up with commentary of rising postpaid ARPA, industry-leading service revenue and EPS growth, and strong EBITDA and free cash flow. Management backed this strength by raising full-year profitability and cash flow guidance while still committing to sizable buybacks and dividends.
Under the hood, TMUS shows a solid profitability profile for a telecom. EBIT margin sits near 19.4%, with EBITDA margin around 35% and profit margin above 11%, supported by a high 62.2% gross margin. Return on equity near the high teens and improving return on capital suggest the company is squeezing more profit out of its large asset base, even with a capital-heavy 5G network. On valuation, a P/E around 15.5 and price-to-sales near 1.7 are not stretched given this growth and cash flow profile, though leverage is meaningful with total debt-to-equity above 2 and a current ratio below 1.
The tape confirms the positive shift after earnings. On the weekly data, TMUS pushed from the mid-$140s to close near $157, with a key jump from roughly $149 to $156–$157 in a single session, showing clear demand on the earnings reaction. The intraday move from a $150 open to a high near $159 before settling around $156–$157 shows traders bought the earnings beat aggressively, then locked in some profits into strength. For short-term traders, that $150 breakout zone now looks like first support, while the $158–$159 area marks initial resistance to watch on the next push.
Conclusion
This is stock news, not investment advice. Timothy Sykes News delivers real-time stock market news focused on key catalysts driving short-term price movements. Our content is tailored for active traders and investors seeking to capitalize on rapid price fluctuations, particularly in volatile sectors like penny stocks. Readers come to us for detailed coverage on earnings reports, mergers, FDA approvals, new contracts, and unusual trading volumes that can trigger significant short-term price action. Some users utilize our news to explain sudden stock movements, while others rely on it for diligent research into potential investment opportunities.
Dive deeper into the world of trading with Timothy Sykes, renowned for his expertise in penny stocks. Explore his top picks and discover the strategies that have propelled him to success with these articles:
- Penny Stocks Trading Guide
- Best Penny Stocks Under $1 to Buy Today
- Top 8 Penny Stocks to Watch on Robinhood
Once you’ve got some stocks on watch, elevate your trading game with StocksToTrade the ultimate platform for traders. With specialized tools for swing and day trading, StocksToTrade will guide you through the market’s twists and turns.
Dig into StocksToTrade’s watchlists here:




Leave a reply