

Veralto Corp stocks have been trading up by 6.77 percent after strong earnings beat expectations and boosted investor confidence.
What Traders Need To Know
- Q3 results topped expectations with adjusted EPS at $1.18 versus $1.09 views and revenue of $1.509B, driven by 7.5% sales growth, margin gains, and strong Water Quality demand.
- Management raised FY26 adjusted EPS guidance to $4.49–$4.52, above prior targets and the $4.40 Street view, alongside higher expected core sales growth and margin expansion.
- Q4 adjusted EPS guidance of $1.13–$1.16 slightly tops consensus, with core sales seen up 5.5%–6.5% and operating margin around 24.5% even as Veralto Corp keeps spending on growth and acquisitions.
- NorthCoast lifted its VLTO price target to $120 from $110; the broader analyst group sits at a $115.13 average target versus the roughly $107.50 recent price.
- Insider activity shows CEO Jennifer Honeycutt sold 7,098 shares for about $745,000 but still holds 120,060 shares, likely a diversification move rather than a full-throttle exit.
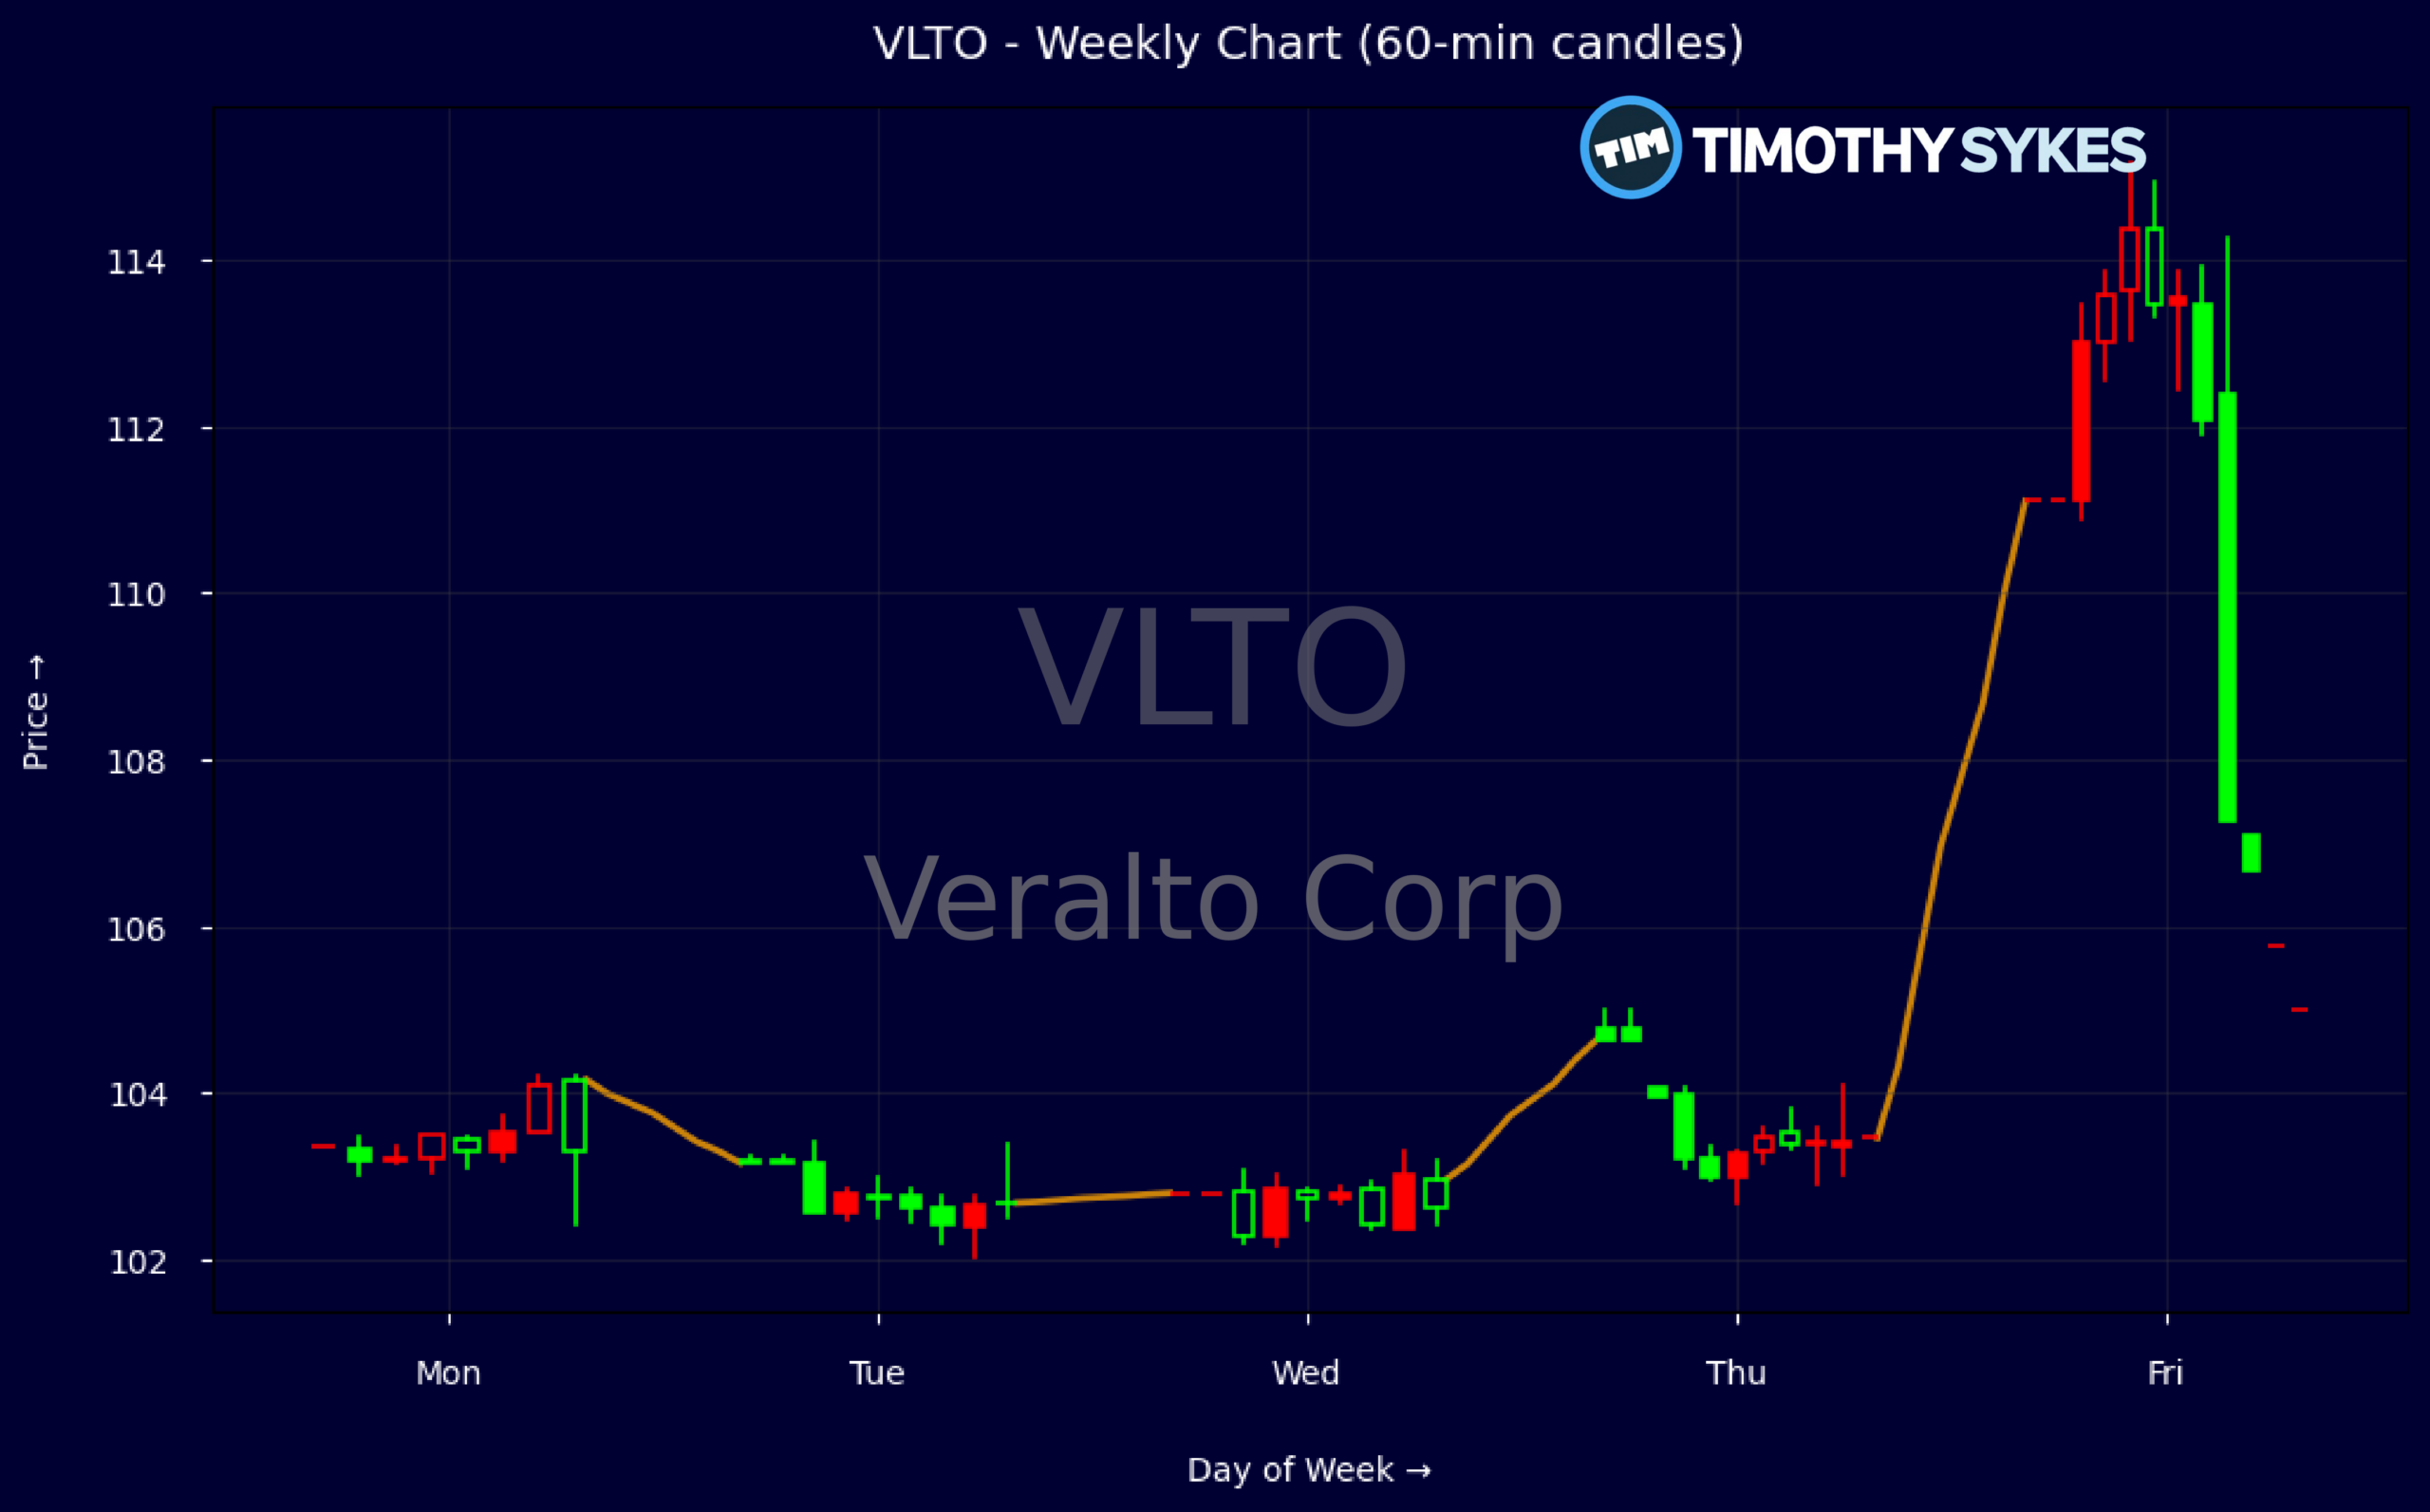
Weekly Update Oct 26 – Oct 30, 2026: On Sunday, November 01, 2026 Veralto Corp stock [NYSE: VLTO] is trending up by 6.77%! Discover the key drivers behind this movement as well as our expert analysis in the detailed breakdown below.
Industrials industry expert:
Analyst sentiment – positive
Veralto (VLTO) is a high-quality Industrials platform with premium fundamentals. A 60% gross margin and ~23% EBIT margin place it at the top end of multi‑industry peers, while ROE above 30% and ROIC near 20% confirm strong capital discipline. Leverage at ~2.8x with 15x interest coverage is manageable, backed by $1.8B cash and robust FCF (~$304M in Q3; P/FCF ~17x). Valuation at ~24x EPS and 4.1x sales embeds quality but not excess.
Technically, VLTO is breaking out. The stock jumped from the low $100s to $111 on a post‑earnings spike, confirming a strong uptrend on the weekly tape after consolidating around $102–105. Five‑minute candles show follow‑through buying rather than a fade, suggesting real institutional demand. Initial support is now $104–105 (prior resistance and volume shelf). For traders, $105 is the key actionable level: buy pullbacks toward $105 with a stop below $101 and upside toward the mid‑teens.
Fundamental catalysts are decisively positive. The company delivered a Q3 beat, raised Q4 and full‑year FY26 EPS guidance ($4.49–4.52 vs $4.40 prior consensus), and is driving margin expansion despite ongoing growth investments. Relative to Industrials benchmarks, VLTO offers structurally higher margins and ROIC, justifying a premium multiple. With Street targets clustering around $113–120, a 12‑month fair value of $118 is warranted, with support at $105 and major resistance near $120.
More Breaking News
Quick Financial Overview
Veralto Corp just backed up its story with numbers. Q3 revenue of about $1.509B and adjusted EPS of $1.18 came in ahead of consensus, powered by 7.5% total sales growth and solid margin expansion. The Water Quality segment and recent bolt-on acquisitions were key drivers, and share repurchases added leverage to EPS growth, which traders tend to reward when the core business is already performing well.
Guidance keeps the pressure on the upside. Management now sees FY26 adjusted EPS at $4.49–$4.52, above both prior guidance and the $4.40 consensus, and is talking up higher non-GAAP core sales growth and better operating margins by 2026. Near term, Q4 EPS guidance of $1.13–$1.16, with 5.5%–6.5% core sales growth and about a 24.5% operating margin, signals that Q3 was not a one-off beat but part of a steady growth path.
On the chart, VLTO just ripped. The stock jumped from roughly $103–$105 to about $111 on heavy intraday range, trading between $107.50 and $115.17 before closing near the high, which shows aggressive dip-buying after earnings. Financially, Veralto Corp runs with strong 60.2% gross margin, about 23% EBIT margin, and return on equity above 30%, supported by $5.503B in annual revenue and healthy $304M quarterly free cash flow. Leverage is meaningful with total debt-to-equity at 1.09, but interest coverage of 15.2 and a current ratio of 1.8 give VLTO room to manage its balance sheet while maintaining a modest dividend around $0.52 per year.
Conclusion
This is stock news, not investment advice. Timothy Sykes News delivers real-time stock market news focused on key catalysts driving short-term price movements. Our content is tailored for active traders and investors seeking to capitalize on rapid price fluctuations, particularly in volatile sectors like penny stocks. Readers come to us for detailed coverage on earnings reports, mergers, FDA approvals, new contracts, and unusual trading volumes that can trigger significant short-term price action. Some users utilize our news to explain sudden stock movements, while others rely on it for diligent research into potential investment opportunities.
Dive deeper into the world of trading with Timothy Sykes, renowned for his expertise in penny stocks. Explore his top picks and discover the strategies that have propelled him to success with these articles:
- Penny Stocks Trading Guide
- Best Penny Stocks Under $1 to Buy Today
- Top 8 Penny Stocks to Watch on Robinhood
Once you’ve got some stocks on watch, elevate your trading game with StocksToTrade the ultimate platform for traders. With specialized tools for swing and day trading, StocksToTrade will guide you through the market’s twists and turns.
Dig into StocksToTrade’s watchlists here:





Leave a reply