

T1 Energy Inc. stocks have been trading up by 11.13 percent after bullish sentiment on expanded drilling and production plans.
Key Takeaways
- TE has bounced from the low $2s to around $2.85, showing near-term momentum after a sharp prior sell-off.
- T1 Energy Inc. is still losing money, with negative margins and heavy leverage, but revenue sits near $755.3M.
- Cash flow shows TE relying on new debt to fund operations and capital spending, a classic high-risk, high-reward setup.
- Intraday trading in TE is tightening into a consolidation zone, giving short-term traders clear breakout and breakdown levels.
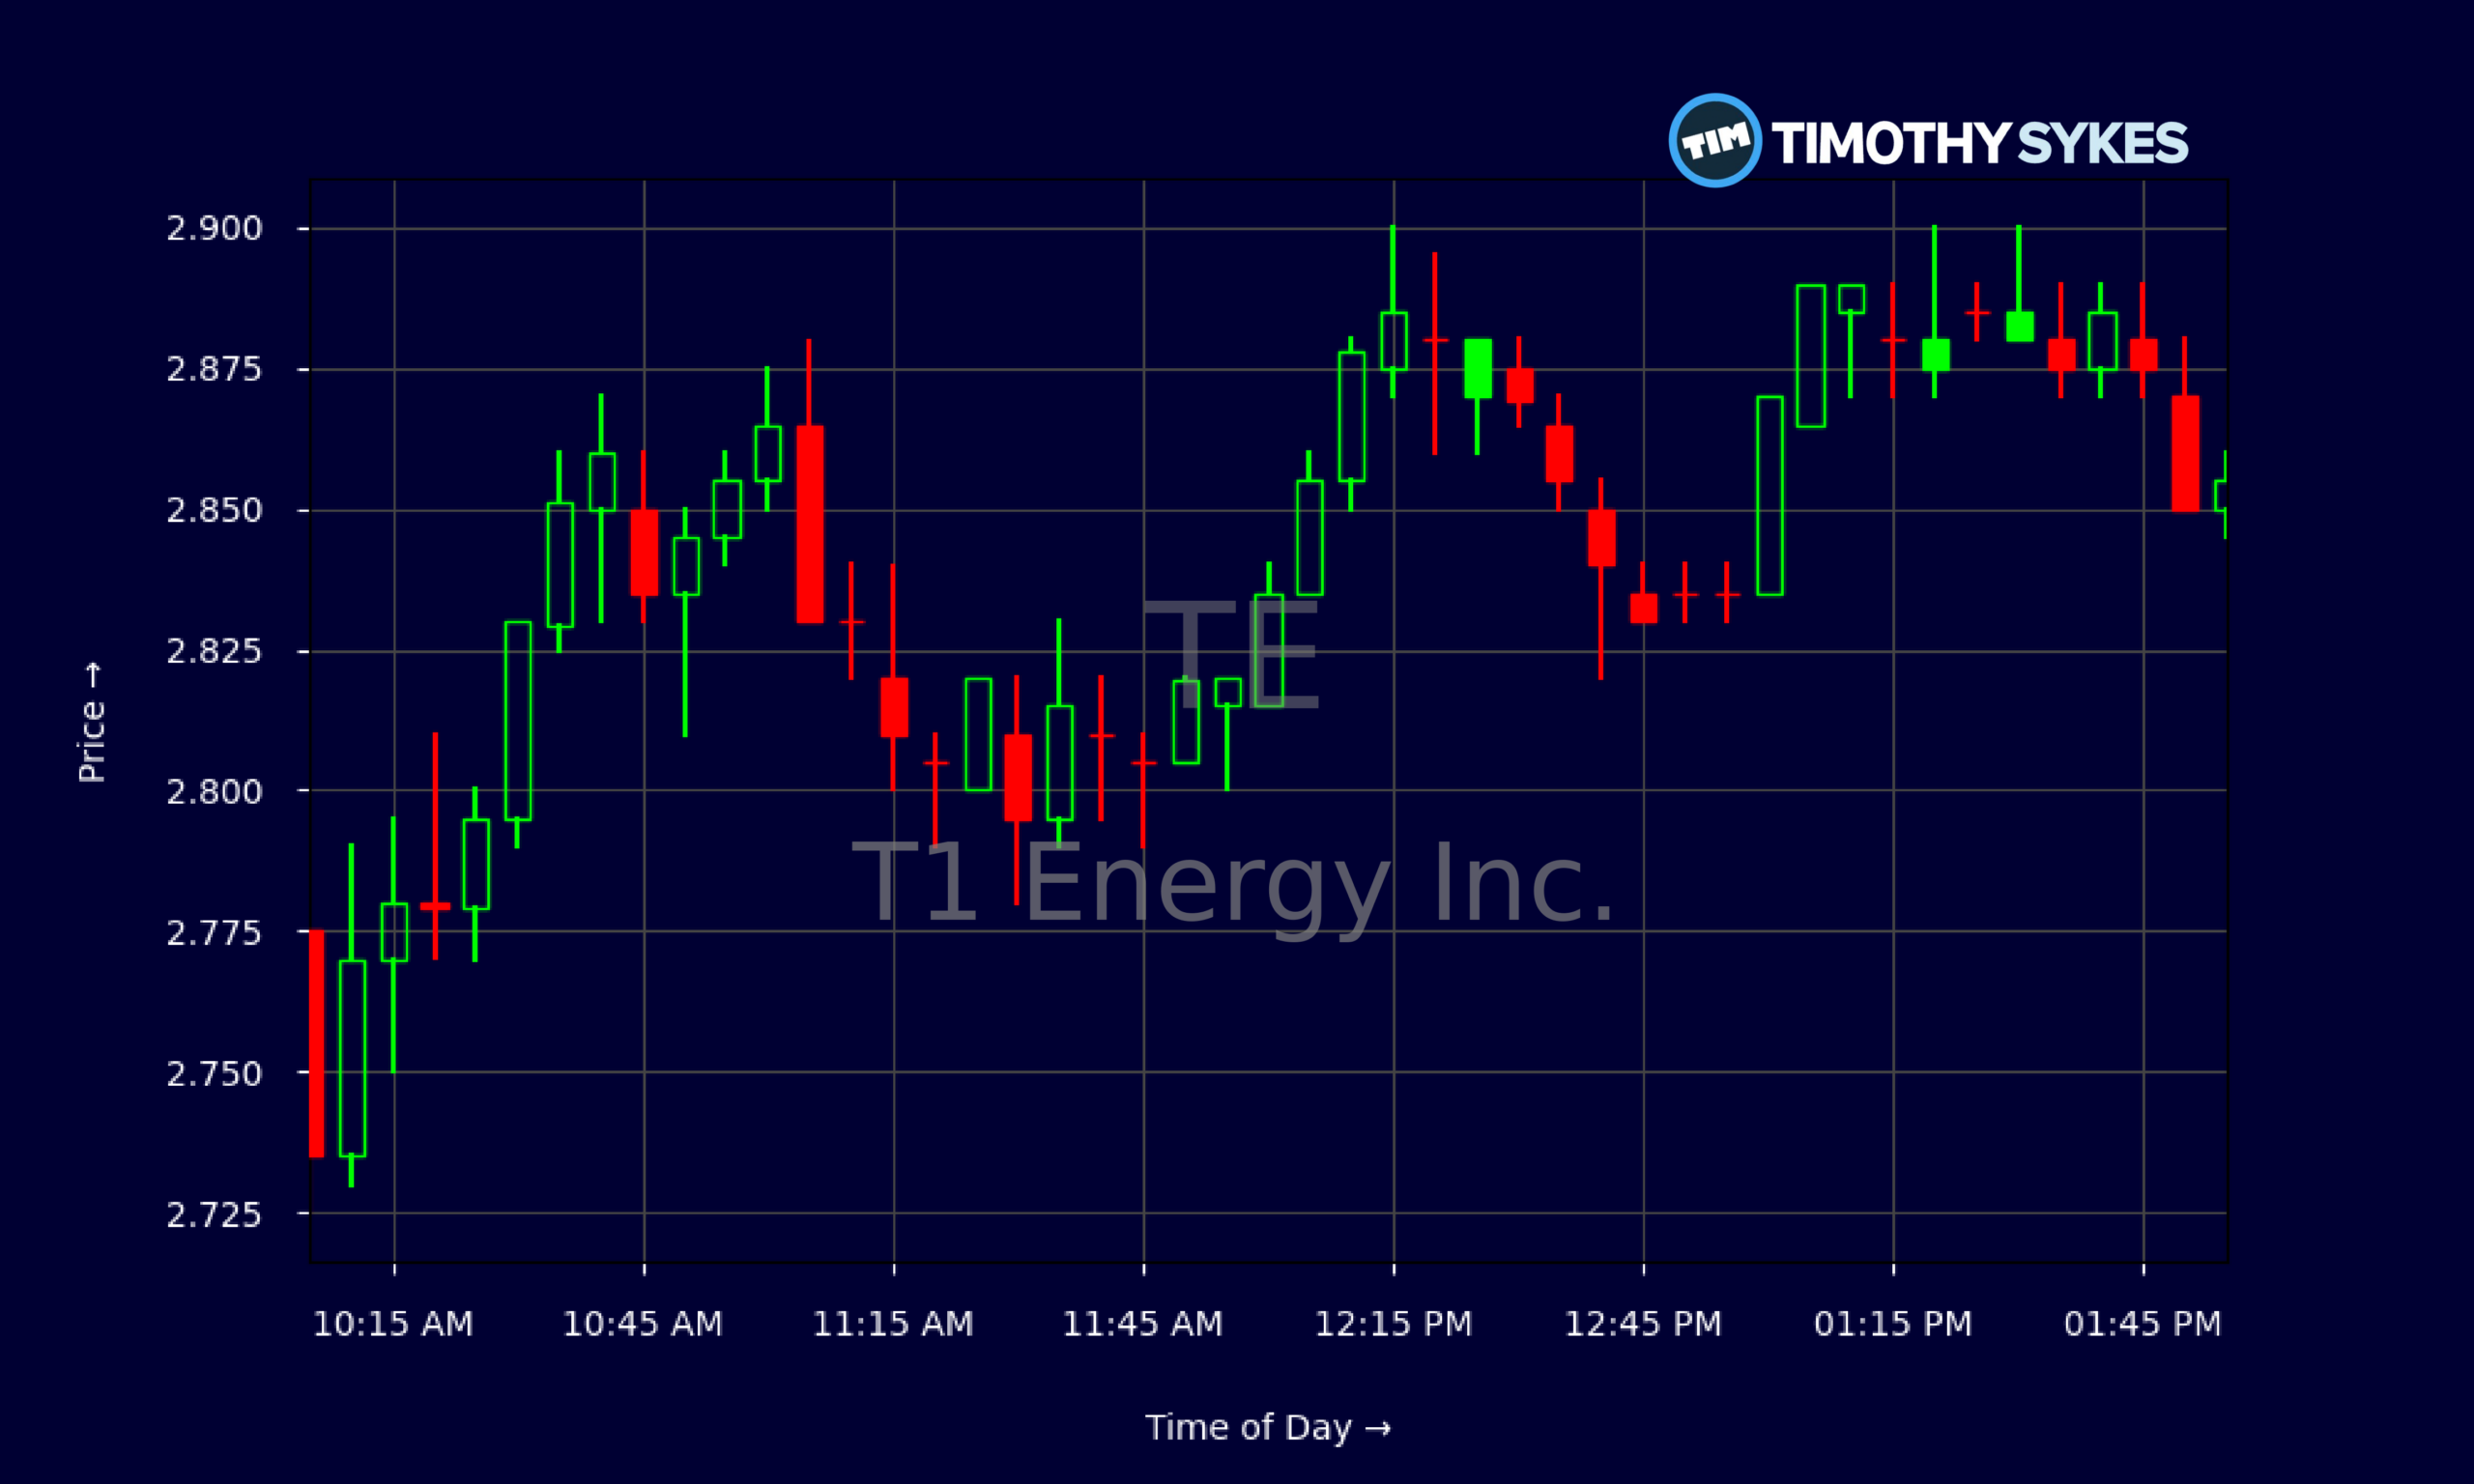
Live Update At 14:02:19 EST: On Tuesday, November 03, 2026 T1 Energy Inc. stock [NYSE: TE] is trending up by 11.13%! Discover the key drivers behind this movement as well as our expert analysis in the detailed breakdown below.
Quick Financial Overview
T1 Energy Inc. is a classic battleground name. TE prints decent sales but struggles to turn that revenue into profit. The latest annualized revenue figure sits near $755.3M, yet TE’s profit margin is deeply negative. Gross margin is only 8.4%, and EBITDA margin sits at -17.1%. That tells traders TE is fighting high costs and weak pricing power.
On the bottom line, TE reported roughly -$43.5M in net loss for the latest quarter, with an EBIT margin around -28.8%. Return on equity is ugly at about -51.5%, and return on assets is roughly -22.6%. T1 Energy Inc. is burning value right now, not creating it.
More Breaking News
The balance sheet shows why traders treat TE as a speculative energy play. Total debt-to-equity is about 2.83, with a leverage ratio near 6. Long-term debt plus leases are roughly $706.5M against only $79.1M in cash and equivalents. The current ratio of 1.3 says T1 Energy Inc. can cover near-term bills, but the quick ratio of 0.3 warns liquidity is tight without inventory sales. TE is not a safe, slow mover; it is a potential momentum vehicle for nimble traders.
Why Traders Are Watching TE Price Action
Price is where all this risk and hope shows up. Over the last few weeks, TE slid from the mid-$3s down to a low around $2.08, then snapped back. T1 Energy Inc. has now clawed its way into the high $2s, closing near $2.85 on the latest day. That move off the lows suggests dip buyers and short-covering stepped in.
Look at the daily chart: TE topped near $3.49 on 2026/10/09, then started a steady bleed lower. The flush accelerated into the $2.10–$2.20 zone by 2026/10/26, where T1 Energy Inc. found support. Since then, each pullback has held higher lows, from $2.17 to around $2.36 and $2.49. That creates a short-term uptrend inside a bigger downtrend.
Intraday, TE shows textbook consolidation. On the 5-minute chart, most of the day traded between $2.80 and $2.90, with repeated rejections near $2.89–$2.90 and solid bids around $2.83–$2.85. Volume isn’t given, but the tight range tells traders that T1 Energy Inc. is coiling. A clean break over the $2.90 area opens the door to a retest of $3.00–$3.10. A crack back under $2.75 puts the $2.50 level in play.
Against that technical backdrop, the fundamentals add fuel to the potential volatility. TE’s free cash flow last quarter was about -$131.2M, while operating cash flow was roughly -$30.1M. Management plugged the gap by issuing around $169.7M in debt, lifting end cash to about $156.4M. T1 Energy Inc. is leaning hard on lenders, which raises both upside surprise potential and downside credit risk.
For day traders and swing traders, that combo—weak fundamentals, heavy debt, improving short-term trend—often means sharp moves in either direction.
Conclusion
T1 Energy Inc. is not a steady compounder. TE is a leveraged turnaround story wrapped in a volatile chart. Revenue is solid, but profits are deep in the red. Margins are negative, returns on capital are worse, and free cash flow is sharply negative. TE is staying afloat by tapping debt markets, pushing total liabilities near $1.37B against equity of roughly $275.3M.
Yet the stock is trying to change the story, at least on the tape. From a low around $2.08, TE has pushed back to the high $2s. The intraday structure shows tight consolidation, a pattern that often ends with a fast trend move. Traders watching T1 Energy Inc. are eyeing $2.90–$3.00 as the key overhead zone and roughly $2.70 as important near-term support.
In this kind of setup, discipline matters more than predictions. TE’s fundamentals say “high risk,” while the chart says “short-term opportunity.” That’s exactly the type of name the Sykes trading community studies. As Tim Sykes likes to remind traders, “The market doesn’t care about your opinion, only your risk management.” As millionaire penny stock trader and teacher Tim Sykes, says, “Cut losses quickly, let profits ride, and don’t overtrade.”. With TE, that means planning entries, exits, and position size before clicking the buy button—because this content is for education and research, and every trade is your own responsibility.
This is stock news, not investment advice. Timothy Sykes News delivers real-time stock market news focused on key catalysts driving short-term price movements. Our content is tailored for active traders and investors seeking to capitalize on rapid price fluctuations, particularly in volatile sectors like penny stocks. Readers come to us for detailed coverage on earnings reports, mergers, FDA approvals, new contracts, and unusual trading volumes that can trigger significant short-term price action. Some users utilize our news to explain sudden stock movements, while others rely on it for diligent research into potential investment opportunities.
Dive deeper into the world of trading with Timothy Sykes, renowned for his expertise in penny stocks. Explore his top picks and discover the strategies that have propelled him to success with these articles:
- Penny Stocks Trading Guide
- Best Penny Stocks Under $1 to Buy Today
- Top 8 Penny Stocks to Watch on Robinhood
Once you’ve got some stocks on watch, elevate your trading game with StocksToTrade the ultimate platform for traders. With specialized tools for swing and day trading, StocksToTrade will guide you through the market’s twists and turns.
Dig into StocksToTrade’s watchlists here:





Leave a reply